
Figure 3.
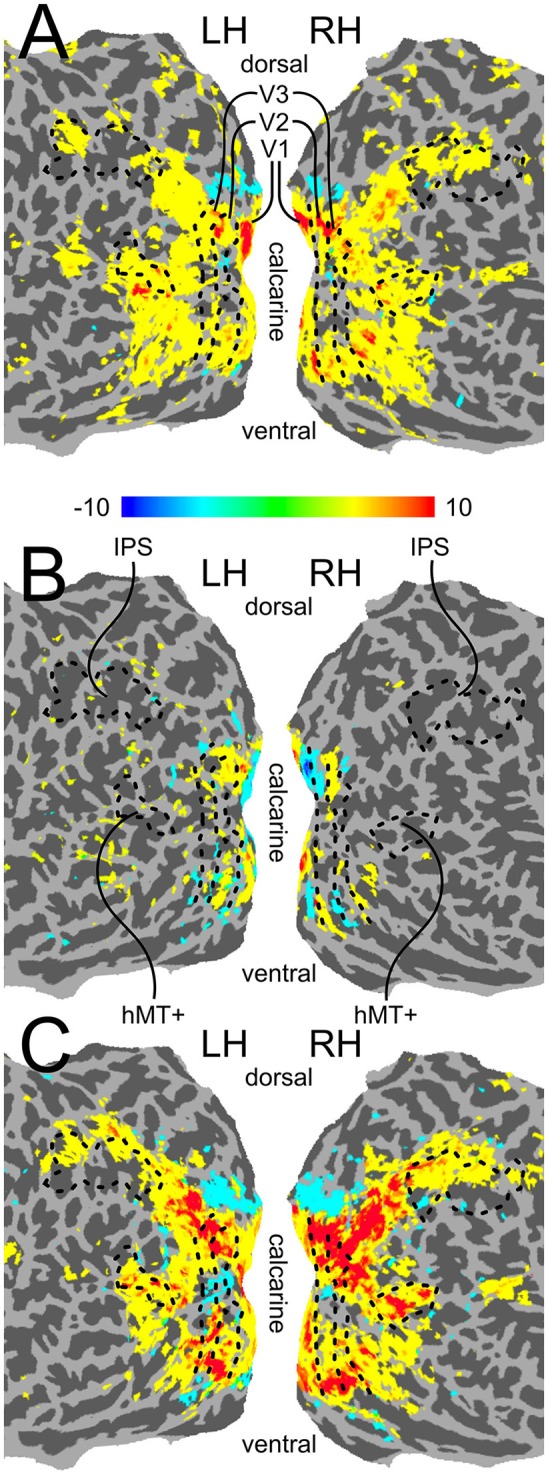
Flattened surface activation maps. (A) The contrast (CLW-S+CCW-S) > Fixation, which served as the voxel selection criterion for our multivariate pattern analysis. (B) The contrast CLW-S > CCW-S, indicating differential activity evoked by the two physical shift directions. (C) The contrast Motion > Fixation. All three maps were created by mapping GLM contrasts from volume space, thresholded at Bonferroni corrected p < 0.01, onto flattened surfaces generated in FreeSurfer, using AFNIs 3dVol2Surf program. The boundaries between retinotopic regions V1–V3, as well as the location of functionally localized hMT+ and the anatomically localized IPS ROI, are indicated with a black outline.