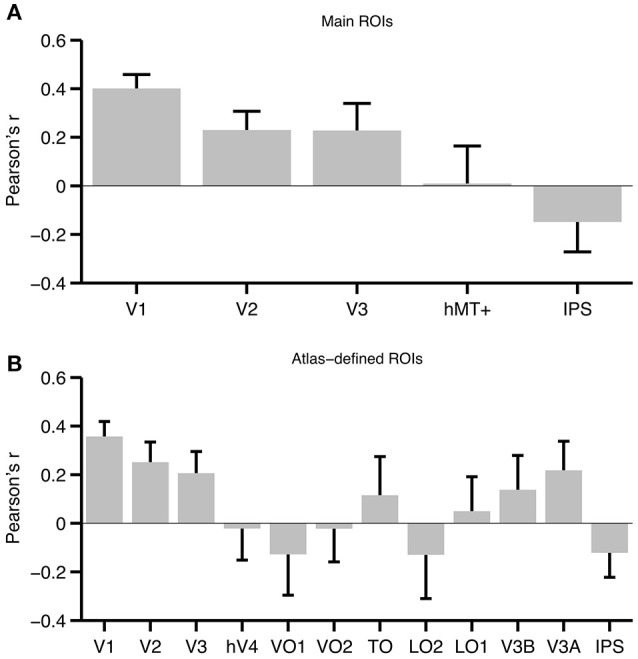
Figure 5.

Average correlation across participants for each ROI. (A) Average correlations for the main set of ROIs. (B) Average correlations for ROIs defined based on a probabilistic atlas (Wang et al., 2015). Note that the atlas-defined TO ROI is the union of TO-1 and TO-2, while IPS is the union of IPS0-5. Error bars represent the standard error of the mean. To aid interpretation, correlations are plotted as Pearson's r, but we emphasize that these values were converted to Fisher's z′ prior to statistical analysis.
