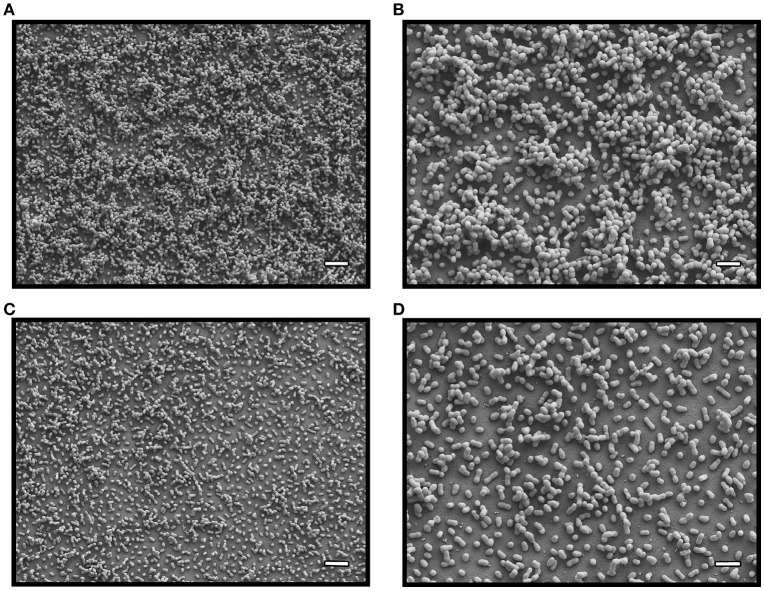
Figure 2.
SEM analysis of bacterial biofilms. Biofilms formed by 17978 (micrographs A and B) and Δ0114 (micrographs C and D) cells at the liquid-air interface. Micrographs A and C were recorded at a 5,000x magnification, while micrographs B and D were collected at a 10,000x magnification. White bars: 4 μm for A,C; 2 μm for B,D.

