
Figure 4.
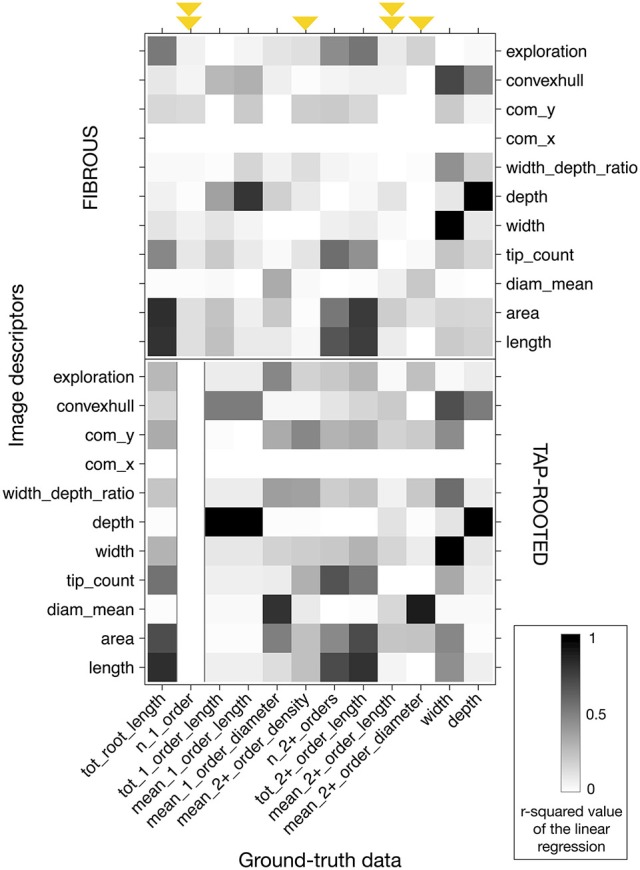
Heatmap of the r-squared values between the different image descriptors and the ground-truth values, for the images without any noise. Black represents an r-squared value of 1; white represents a value of 0. Upper panel: fibrous root dataset. Lower panel: tap-root dataset. Arrows highlight the ground-truth data that cannot be accurately described with the different descriptors. The arrows were doubled when it was the case for both fibrous and tap-rooted root systems.