
Figure 7.
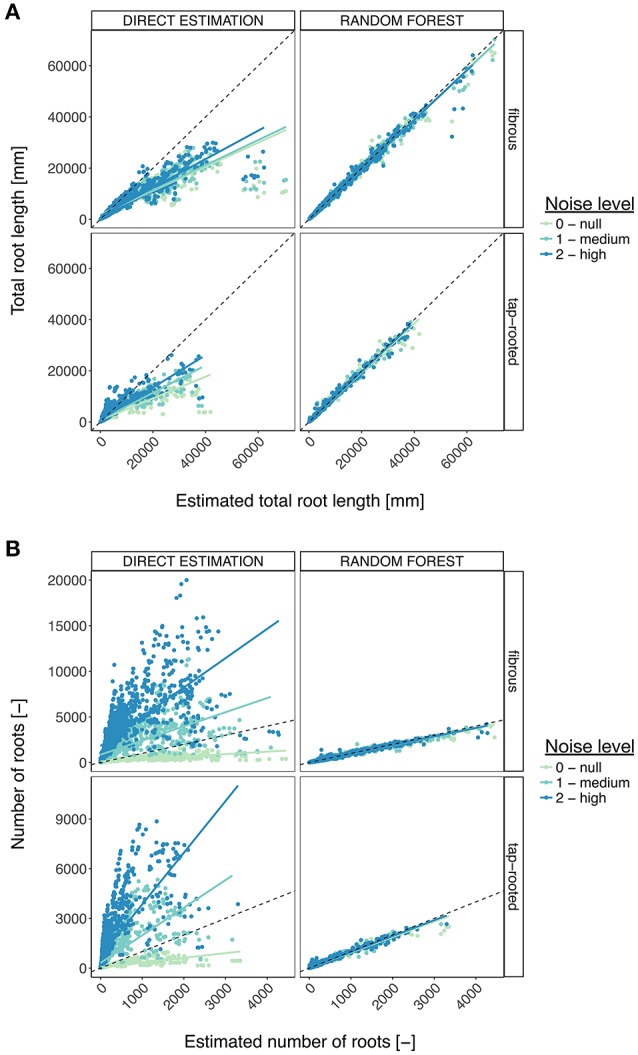
Comparison between the direct trait estimation and the Random Forest approach, for the different root system types and the different levels of noise. (A) Comparison, for the total root length, of the accuracy of both approaches. The dotted line represents the diagonal. The plain line represents the linear regression. (B) Same, for the number of roots.