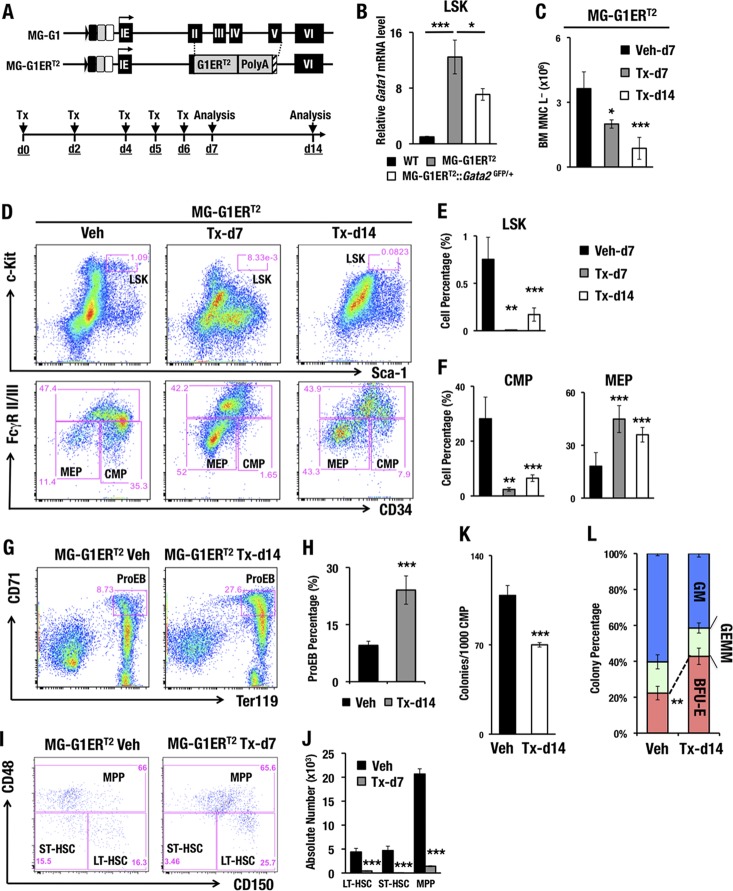
FIG 3.
Increased erythropoiesis and HSPC depletion in the adult bone marrows of MG-G1ERT2 mice upon tamoxifen treatment. (A) Structure of the MG-G1ERT2 BAC transgenic construct. The G1ERT2 fusion cDNA was integrated by homologously replacing the 2nd to 5th exons of the Gata1 gene in the MG-G1 BAC DNA. (Top) Transgenic mice were generated using the MG-G1ERT2 BAC construct. (Bottom) Tamoxifen (Tx) was injected intraperitoneally into the mice on days 0, 2, 4, 5, and 6. The analysis was performed on days 7 and 14. (B) Gata1 mRNA levels in LSK cells from WT, MG-G1ERT2, and MG-G1ERT2::Gata2GFP/+ bone marrows from adult mice without tamoxifen treatments. (C) Number of bone marrow lineage-negative mononuclear cells (BM MNC L−) in vehicle (Veh)- or tamoxifen-treated MG-G1ERT2 mice at day 7 or 14. (D) Flow cytometry analysis of LSK cells (upper panels) and progenitors (lower panels) in MG-G1ERT2 mice treated with vehicle (left) or with tamoxifen for 7 days (middle) or 14 days (right). (E and F) Percentages of LSK cell (E) and CMP and MEP (F) populations. Note that after tamoxifen treatment, the percentages of LSK cells and CMPs were significantly reduced, while that of MEP was increased. (G) Flow cytometry analysis of proerythroblasts from MG-G1ERT2 mouse bone marrow 14 days after vehicle or tamoxifen treatment. (H) Percentages of CD71+ Ter119+ proerythroblast cells. (I) LT-HSC, ST-HSC, and MPP populations were separated by means of flow cytometry from LSK-gated adult bone marrow cells from MG-G1ERT2 mice 7 days after vehicle (left) or tamoxifen (right) treatment. (J) Absolute numbers of the LT-HSC, ST-HSC, and MPP subsets. Note the significant decreases in LT-HSC, ST-HSC, and MPP populations in LSK-gated MG-G1ERT2 mouse bone marrow cells. (K and L) Colony number per 1,000 CMP cells (K) and percentages of CFU-GM, CFU-GEMM, and BFU-E colonies (L) from vehicle- or tamoxifen-treated MG-G1ERT2 mice. Data shown are the means ± SD for three to seven mice. *, P < 0.05; **, P < 0.01; ***, P < 0.001 (unpaired Student's t test).

