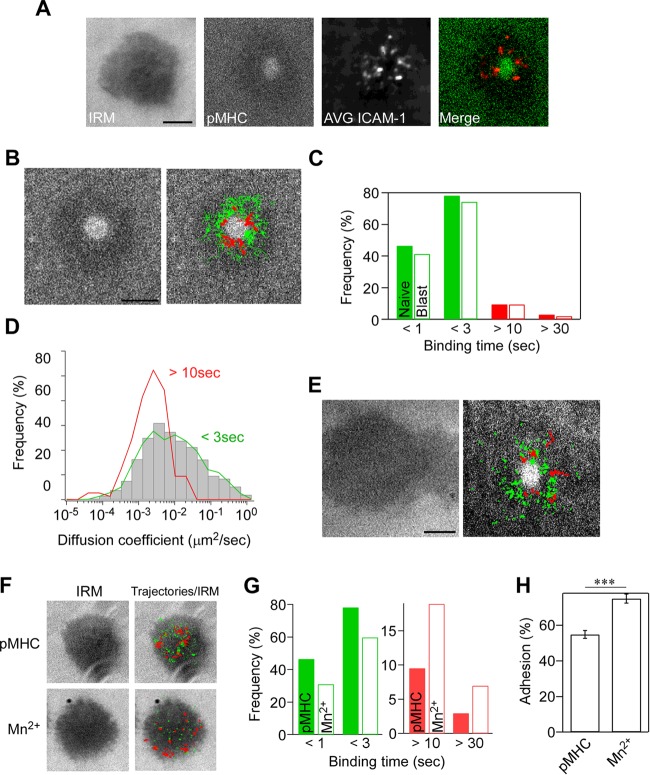
FIG 1.
Single-molecule measurement of ICAM-1 binding to LFA-1. Naive OT-II T cells were incubated on supported planar lipid bilayers presenting ATTO-647N-labeled ICAM-1-GPI (300 molecules/μm2) and ovalbumin peptide (OVA323–339) complexed with I-Ab (200 molecules/μm2). Images were recorded at 30 frames/s using a TIRF microscope. (A) Representative images of interference reflection microscopy (IRM) and pMHC, averaged time-lapse images of ICAM-1 (6,000 frames) (AVG ICAM-1), and a merged image of pMHC (green) with averaged ICAM-1 (red). Scale bar, 2.5 μm. (B) Trajectories of individual bound ICAM-1 spots in IS of naive OT-II T cells on lipid bilayers presenting pMHC. Trajectories with a lifetime of more than 0.5 s (green) and 10 s (red) are shown. Scale bar, 2.5 μm. (C) Lifetime profiles of ICAM-1 binding obtained from naive OT-II T cells (closed bar) and OT-II T cell blasts (open bar). The calculated two-way chi-square P value was 0.723. (D) Profiles of diffusion coefficients (D) of trajectories for bound ICAM-1 with lifetimes of less than 3 s (low-intermediate) and longer than 10 s (high). Gray bars indicate D of all trajectories. Data from 842 individual trajectories of at least 15 synapses are shown. The difference between D of high and low-intermediate is statistically significant (P < 0.0001 by Mann-Whitney test). (E) Trajectories of individual ICAM-1 spots in IS of OT-II T cell blasts as described for panel B. (F to H) The effect of Mn2+ versus pMHC on single-molecule LFA-1–ICAM-1 interactions. (F) Images of IRM alone and merged IRM plus trajectories of LFA-1-bound ICAM-1 with lifetimes of more than 0.5 s (green) and 10 s (red). (G) Lifetime of ICAM-1 binding with (closed bar) or without (open bar) 1 mM Mn2+. (H) Comparison of the attachment frequency with or without Mn2+. Percentages of attached cells were calculated based on the IRM images for multiple fields (***, P < 0.0001 by Mann-Whitney test).

