FIG 6.
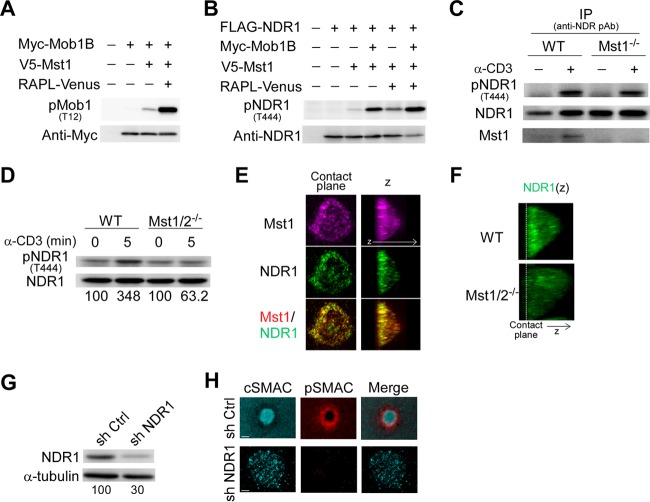
Requirement of TCR-triggered activation of NDR1 for IS formation. (A) Enhanced phosphorylation of Mob1B by Mst1 in the presence of RAPL. Mob1B phosphorylation was detected with anti-phospho-Mob1B (pT12) following transfection with Myc-Mob1B, V5-Mst1, and RAPL-Venus as indicated. (B) RAPL and Mob1B induced NDR1 phosphorylation by Mst1. Phosphorylation of NDR1 (pT444) was detected with anti-phospho-NDR antibody (pAb). (C) Phosphorylation of NDR1 (pT444) in wild-type and Mst1−/− T cells after TCR ligation. T cells stimulated with anti-CD3 or left unstimulated were examined for NDR1 phosphorylation after immunoprecipitation (IP) of NDR1. The blots were reprobed for NDR1 and Mst1. (D) Phosphorylation of NDR1 (pT444) in wild-type and Mst1/2 DKO T cells were examined as described above. Percentages of NDR1 phosphorylation were normalized to total NDR1. (E) Localization of Mst1 and NDR1 in IS. OT-II T cell IS were fixed and immunostained for Mst1 (magenta) and NDR1 (green). Colocalization is indicated by yellow in the merged image (bottom). (F) 3D image (z) for NDR1 in IS of OT-II T cell blasts from wild-type and Mst1/2 DKO mice. The dashed line indicates the contact plane. (G) Knockdown of NDR1 with shRNA. Expression of NDR1 in cultured OT-II T cells transduced with lentiviral vectors containing control shRNA (sh Ctrl) and NDR1-specific shRNA (sh NDR1). Values at the bottom indicate the percentages of NDR1 expression normalized to α-tubulin expression. (H) Representative images of IS (cSMAC, pSMAC, and merged) in NDR1 knockdown T cell blasts. Scale bars, 2.5 μm.

