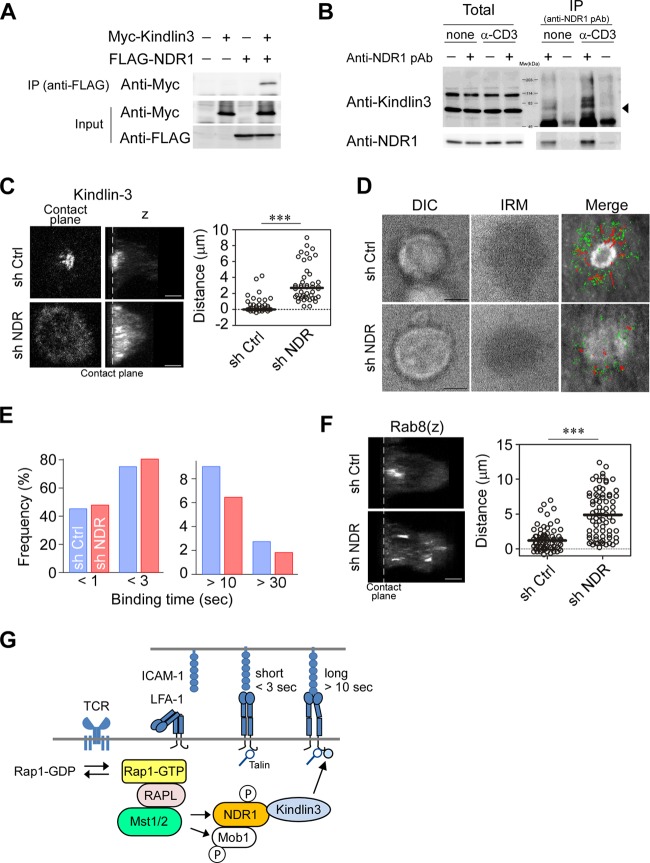
FIG 7.
NDR1 regulates localization of kindlin-3 and Rab8. (A) Association of NDR1 and kindlin-3. 293T cells transfected with Myc–kindlin-3 and FLAG-NDR1 as indicated were subjected to immunoprecipitation (IP) of FLAG-NDR1 followed by immunoblotting for Myc–kindlin-3. (B) Primary T cells stimulated with anti-CD3 or left unstimulated were analyzed for association of NDR1 with kindlin-3. IP with anti-NDR Ab was immunoblotted for kindlin-3. Total and precipitated proteins are indicated. The arrowhead indicates the predicted molecular mass of kindlin-3 (75.6 kDa). (C) Mislocalized kindlin-3 in NDR1 knockdown T cell blasts. Representative views at the contact plane and 3D images (z) of NDR1 knockdown (sh NDR) and control (sh Ctrl) OT-II T cells. Distances of peak intensities from the contact plane of kindlin-3 are shown. Scale bars, 2.5 μm. ***, P < 0.001. (D and E) Single-molecule measurement of LFA-1–ICAM-1 interactions for control and NDR1 knockdown T cell blasts. (D) Representative images of DIC, IRM, and the cSMAC overlaid with trajectories of LFA-1/ICAM-1 binding in control and NDR1 knockdown OT-II T cell blasts. (E) Profiles of ICAM-1 binding lifetime in control (blue) and NDR1 knockdown (red) cells were calculated from 1,568 and 1,993 trajectories, respectively. The two-way chi-square P value was 0.003. (F) 3D images (z) of Rab8 in IS of control and NDR1 knockdown OT-II T cells. (Right) Distances of peak intensities from the contact plane are shown. Scale bar, 2.5 μm. ***, P < 0.001. (G) A schema of the Rap1 signaling pathway to kindlin-3.

