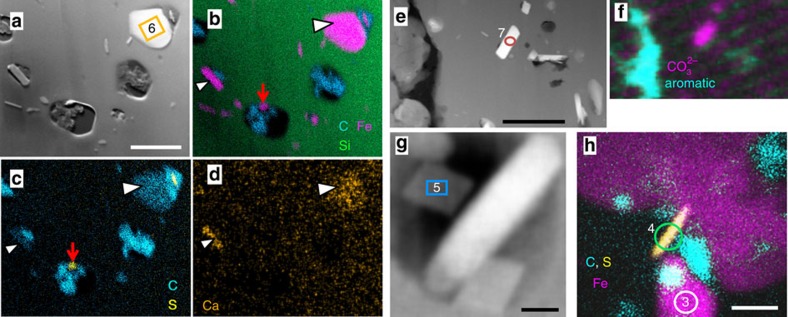
Figure 4. Intra-microfossil siderite and Fe2+ sulfides.
(a) STEM dark-field image. (b–d) EDXS mappings of a showing quartz (Si: green in b), siderite (Fe: pink in b, minor Ca: orange in d, arrowheads), and Fe+S minerals (S in yellow in c, red arrows in b,c) that are systematically nanoscale and embedded in organic matter (C: cyan in b,c). Scale bar, 500 nm. (e,f) STEM dark-field image (e) and STXM mapping (f) of e showing carbonate (pink) and aromatic carbon (cyan). The rod-shaped (red circle) crystal is siderite. Scale bar, 500 nm. (g) STEM dark-field image showing rhombohedra of siderite (for example, blue box) associated with greenalite (white rod). Scale bar, 50 nm. (h) EDXS mapping of a nanoscale Fe2+ and S (yellow) crystal embedded in organic carbon (cyan) between two greenalite (Fe: pink) crystals. Scale bar, 100 nm. Numbered boxes and circles in a,e,g,h outline target areas of EDXS spectra displayed in Supplementary Figs 15 and 16 with corresponding numbers.

