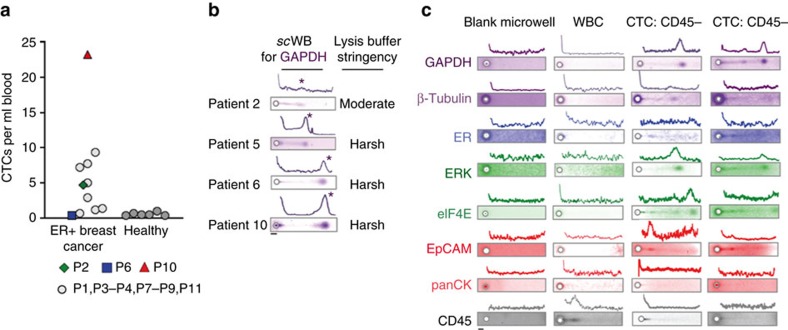
Figure 3. Optimization of the rare-cell scWB for direct protein measurement in patient-derived CTCs.
(a) CTC counts normalized to the blood volume processed by the isolation tool. CTC count for metastatic ER+ breast cancer patients (n=12): 0.33–23.25 CTCs per ml; CTC count for age-matched healthy donors (n=6): 0.33–1.00 CTCs per ml. CTC threshold was set by mean+2 s.d. from healthy donor data at 1.06 CTCs per ml, with 81.8% of the breast cancer patients classified as positive for CTCs. Enumeration for Patient 5 was not possible, as the sample was consumed by the scWB. (b) Fluorescence micrographs and intensity plots from rare-cell scWB analysis of GAPDH in CTCs from Patients 2, 5, 6 and 10 of CTC lysis conditions. Asterisks mark GAPDH peaks. (c) Fluorescence micrographs and intensity plots from rare-cell scWB handling and analysis of representative patient-derived CTCs using nomenclature from Fig. 2a. Micrographs of rare-cell scWB of patient-derived CTCs in representative cases where CD45 was not detected (CD45−). Scale bars, 50 μm.

