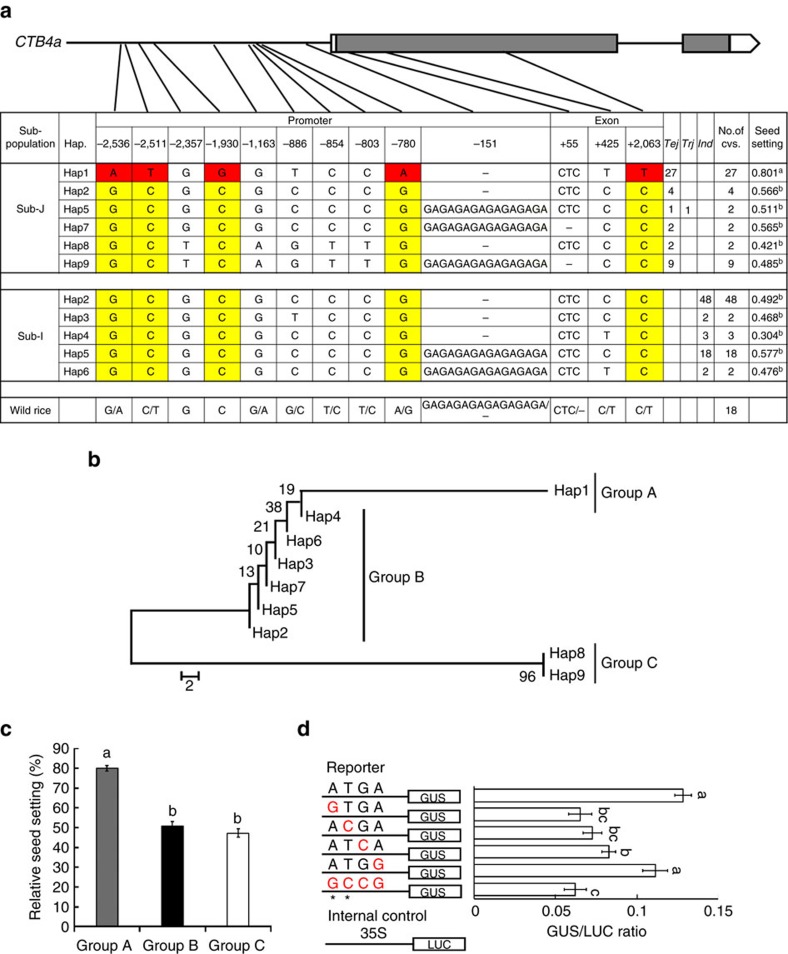
Figure 3. Haplotype analysis of CTB4a.
(a) Haplotype analysis of the CTB4a gene region from 119 rice cultivars and 18 O. rufipogon accessions. Ind, indica population; Sub-J, japonica population; Sub-I, indica population; Tej, temperate japonica population; Trj, tropical japonica population. Data represent means (n=5). (b) Phylogenetic tree of the nine haplotypes divided into Groups A (Hap1), B (Hap2- Hap7) and C (Hap8- Hap9). The scale bar indicates average number of substitutions per site for different haplotypes. (c) Relative seed setting of the three Groups. Data represent means±s.d. (d) Transient expression assay of promoter activity in Arabidopsis protoplasts. Left, constructs with site-directed mutations at the four SNPs in the promoter region. Two cis-elements changed at SNP2536 and SNP2511 indicated with ‘*'. Right, relative GUS/LUC values. The presence of the same lowercase letter above the error bar denotes a non-significant difference between the means (P>0.05, Student's t-test).

