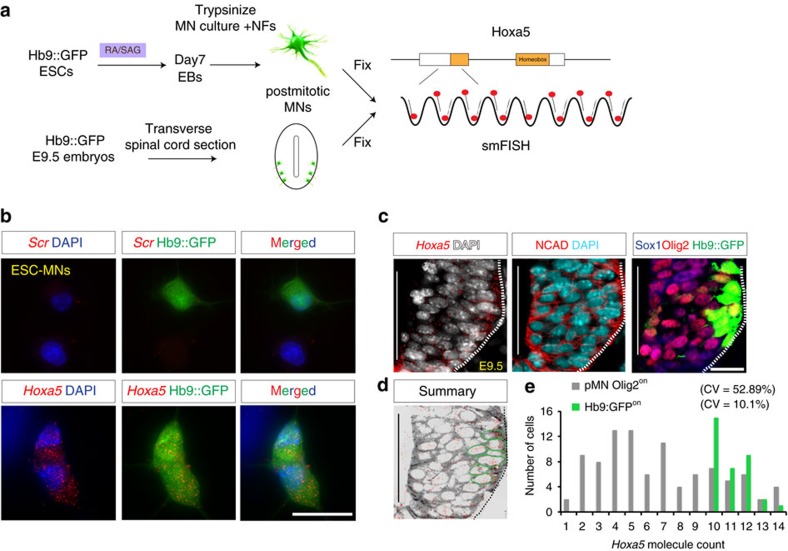
Figure 2. Strong heterogeneous expression levels of Hoxa5 mRNAs in the pMNs.
(a) Schematic illustration of single molecule RNA FISH (smRNA FISH) of Hoxa5 transcripts in vitro and in vivo. (b,c) smRNA FISH of Hoxa5 transcripts on Hb9::GFP ESC-derived motor neurons (b) or on sagittal sections (5–10 μm) of mouse spinal cord of E9.5 Hb9::GFP mouse embryos (c). Scr: scrambled sequence control probe. Scale bar represents 20 μm. (d,e) smRNA FISH signal quantifications show strong cellular variance of Hoxa5 mRNA number in the pMNs (Olig2on, GFPoff) compared to robust and steady Hoxa5 levels in postmitotic MNs (GFPon). N-cadherin (NCAD) is used to demarcate cell boundaries and nuclei are counterstained with DAPI. CV: coefficient of variation.

