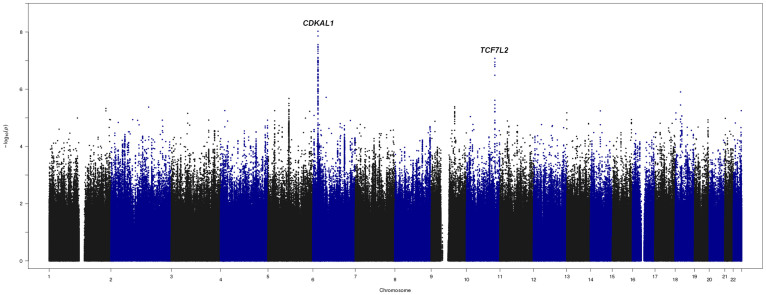
Figure 2. Manhattan plot.
Plot shows results of T2DM GWA analysis assuming additive impact in 3286 Lebanese using >5,000,000 genotyped or imputed SNPs. The Y-axis corresponds to the significance of the association (−log10 p-values). The X-axis represents the physical location of the variant colored by chromosome.

