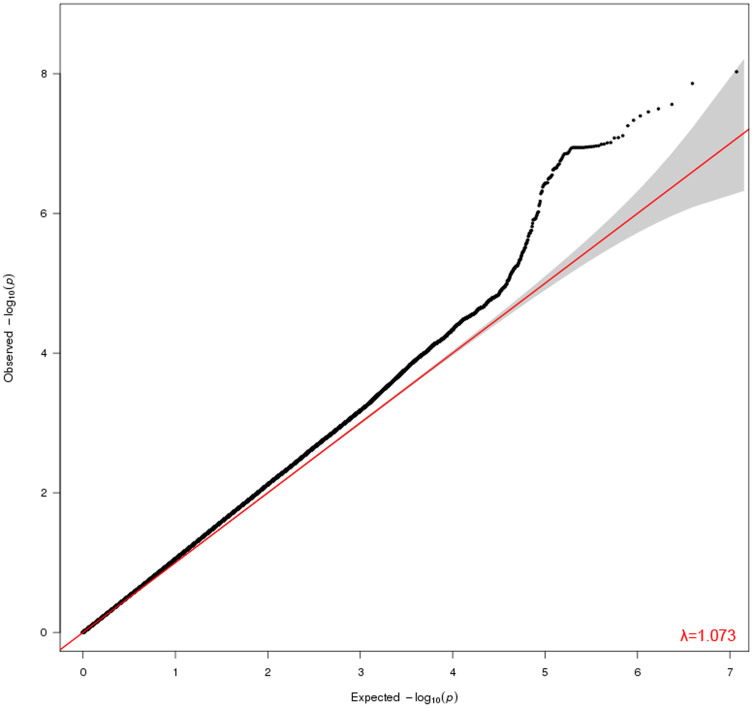
Figure 4. Quantile-Quantile plot of the GWAS results.
Plot compares observed −log10 p values of the tested SNPs on the vertical axis to expected −log10 p values under the null hypothesis on the horizontal axis. The genomic control ratio was 1.073, indicating the lack of strong effect of systematic error such as population stratification.

