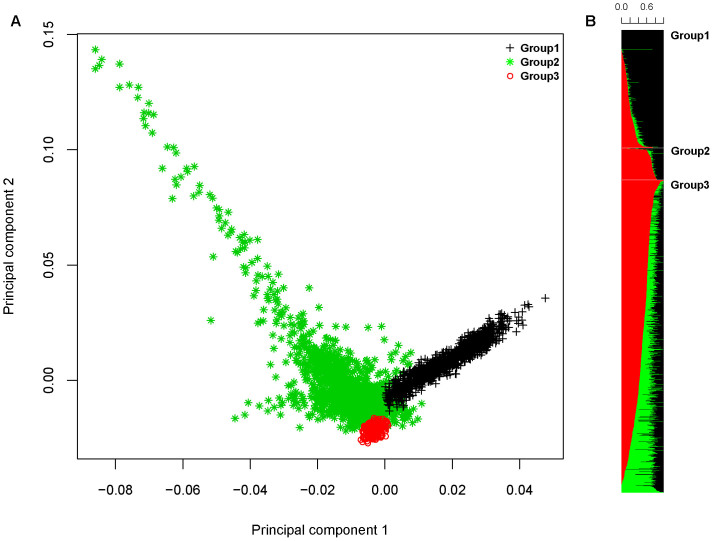
Figure 5. Population structure in the Lebanese.
A) Principal component analysis shows an orthogonal population structure. Model-based clustering using mclust identifies three groups similar to previously reported stratification in the Lebanese. B) Estimation of individual ancestry using ADMIXTURE at K = 3 shows three groups with disparate proportions of ancestral allele frequencies.

