Fig. 1.

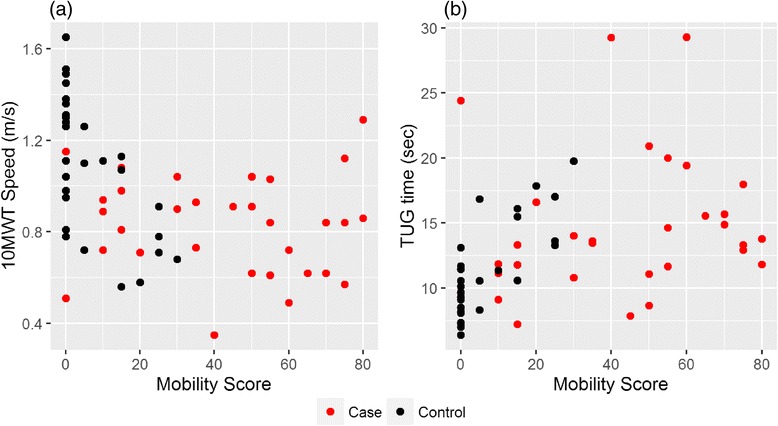
Scatterplots of the results of the mobility score against the 10MWT speeds a and TUG test times b. Cases and controls are represented by red and black dots respectively

Scatterplots of the results of the mobility score against the 10MWT speeds a and TUG test times b. Cases and controls are represented by red and black dots respectively