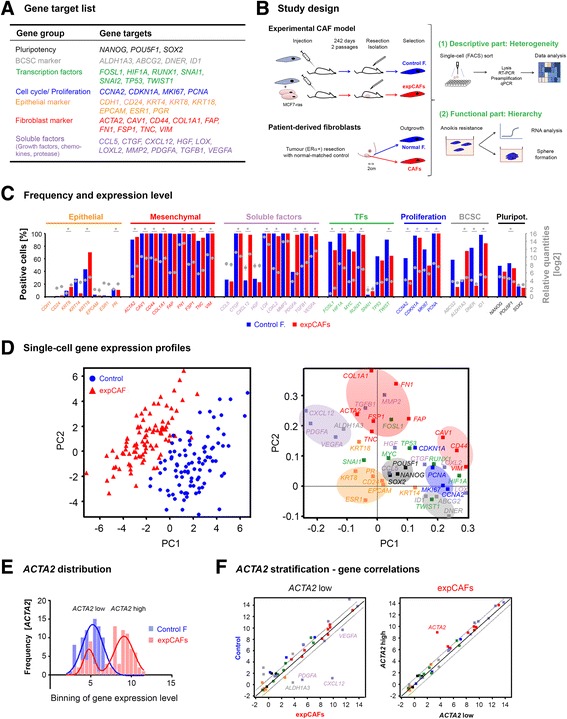
Fig. 1.

Molecular markers distinguish normal fibroblasts from the tumour-activated counterparts. a Table of selected gene targets colour-coded according to their attributes (gene group). b Schematic representation of study design. c Basic statistics of single-cell gene expression profiles of experimental fibroblast model. Graphs represent frequency of selected gene targets in percentage as bars and average gene expression levels given as log2-transformed relative quantities depicted as dots. Error bars represent SEM (*p-value < 0.05 Student t-test, Control F: control fibroblast, expCAF: experimentally-generated cancer-associated fibroblast). d (Left panel) Principal component analysis (PCA) of 183 individual Control fibroblasts (n = 92, blue dots) and expCAFs (n = 91, red triangles). In the principal component projections the position of a single cell (scores) is based on the expression of the analysed genes (n = 43), each dot represents a single cell. (Right panel) Plot represents the gene loadings for the PCA. Principal component projection of the genes illustrates the contribution of each gene to the scores of PC1 and PC2. Groups of genes are indicated as follows; orange: epithelial, red: fibroblast markers, purple: chemokines, green: transcription factors, blue: proliferation markers, grey: breast cancer-specific stem cell markers, black: pluripotency. e Histogram of distribution of ACTA2-specific gene expression with Gaussian regression analysis for control fibroblasts (blue line) and expCAFs (red line: sum of two Gaussians) demonstrating a bimodal gene expression pattern. f Plots depict correlations of gene expression between ACTA2 low expressing expCAFs and Control fibroblasts (left) and ACTA2 high expressing expCAFs (right). Genes outside the significance area (dotted black line) are denoted
