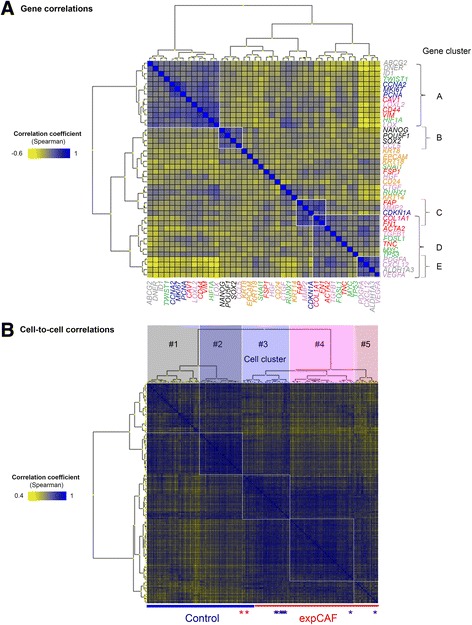
Fig. 2.

Gene and cell-to-cell correlation analysis. a Heatmap (unsupervised clustering, Euclidian distance) demonstrating gene correlations coefficients (Spearman) based on gene expression of all cells. b Heatmap (unsupervised clustering, Euclidian distance) demonstrating cell-to-cell correlations coefficients (Spearman) based on individual gene expression profile of each cell. Manual grouping was performed according to hierarchical clustering to obtain five subgroups
