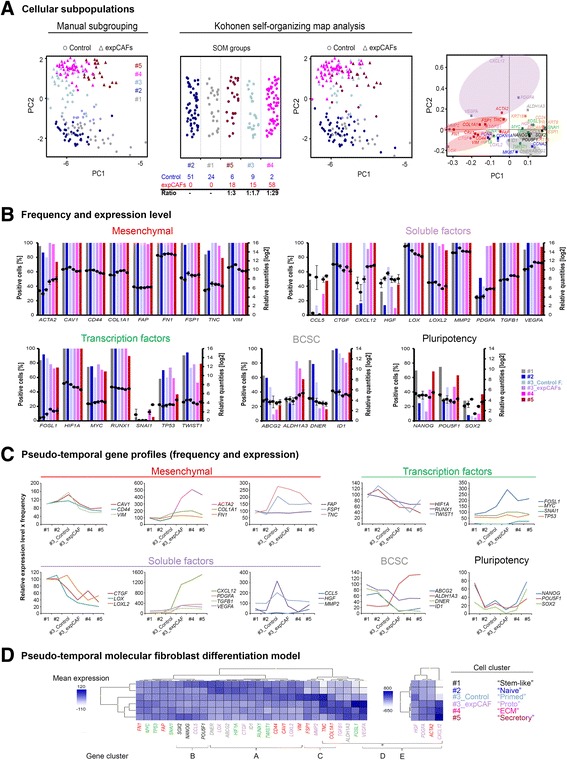
Fig. 3.

Identification of fibroblast subpopulations and generation of a molecular differentiation model. a Principal component analysis (PCA) of 183 individual normal (n = 92, dots) and experimentally generated cancer-associated fibroblasts (expCAFs, n = 91, triangles) colour-coded according to their subgroups. Data was normalized by autoscaling data per cell to eliminate differences due to global expression level (left). Kohonen self-organizing map (SOM) analysis confirms subgroups based on cell-to-cell correlation (middle). According gene loadings for PCA. Gene clusters are highlighted (right). b Basic statistics of single-cell gene expression profiles with regard to each subgroup. Bar graphs represent frequency of selected gene targets in percentage and average gene expression levels given as log2-transformed relative quantities are depicted as dots. Error bars represent SEM. c Graphs depict pseudo-temporal gene expression profile representing the product of relative expression level and frequency across subgroups. d Heatmap (unsupervised clustering) of pseudo-temporal gene profiles (combined frequency and relative average expression) per subgroup which were assigned a specific cellular state according to their most prominent gene transcripts thereby creating a pseudo-timeline of molecular differentiation states. Genes with extremely pronounced differences between subgroups were plotted separately for better visualization
