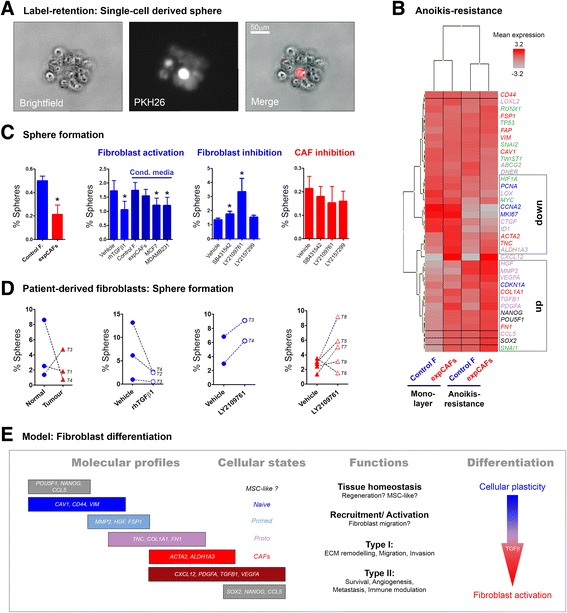
Fig. 5.

Anoikis-resistance and sphere formation of fibroblast cells. a Microscopic picture depicting a sphere derived from a PKH-labelled single cell after 5 days in non-adherent culture conditions. b Heatmap (unsupervised clustering) of bulk RNA expression levels before and after 24 h of anoikis resistance. c Graphs represent sphere formation capacity as percentage of control (blue) and expCAFs (red) without and upon treatment with 10 ng/ml of recombinant human TGFβ1 (rhTGFβ1), 72 h cell-conditioned media of breast cancer cell lines (MCF7, MDA-MB-231) or 10uM of TGFβ signalling-targeted pharmacological inhibitors (TGFBR1 inhibitors: SB431542, LY2157299; dual TGFBR1/TGFBR2 inhibitor: LY2109761). Three independent experiments with triplicates were performed. d Graphs representing sphere formation as percentage of individual patient-derived fibroblasts (triplicates) depicted as normal-matched (blue) and cancer-associated fibroblast (red) and paired treatment response. Each sample is marked with corresponding tumour number (T1-T9). Clinical information for each tumour can be found in Additional file 1. e Working model of hierarchical fibroblast differentiation comprising diverse activation states with overlapping molecular profiles
