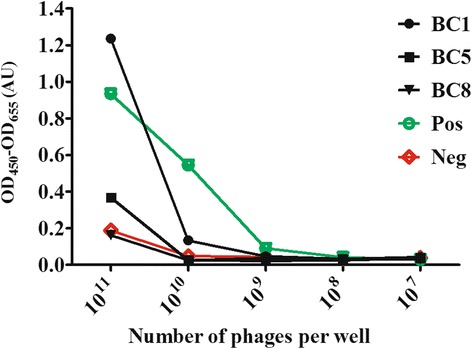
Fig. 2.

ELISA with dilution arrays of monoclonal phage antibodies on K19+/K14+ enriched cells. The y-axis depicts the ELISA signal in arbitrary units for serial dilutions of phages antibodies. The x-axis depicts the phage titer in the dilution series. Included in the figure are data for the three phage domain antibodies BC1, BC5 and BC8 as well as those of the positive and negative controls (scFvs)
