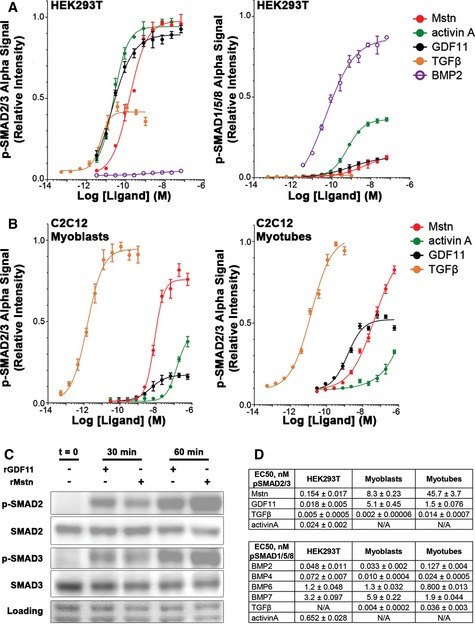
Relative p‐SMAD2/3 (left) and p‐SMAD1/5/8 (right) response, evaluated by AlphaLISA signal, of HEK293T cells after 1‐h exposure to recombinant myostatin (Mstn), activin A, GDF11, TGFβ, and BMP2.
Relative p‐SMAD2/3 response of C2C12 myoblasts (left) and myotubes (right) after 1‐h exposure to Mstn, activin A, GDF11, and TGFβ.
Phosphorylation of SMAD2 and SMAD3 in differentiated C2C12 myotubes following stimulation with recombinant Mstn or GDF11 for 30 and 60 min, as detected by immunoblotting. Equal loading is verified by Ponceau Red staining.
EC50 values (in nM) for p‐SMAD2/3 and p‐SMAD1/5/8 responses of HEK293T, C2C12 myoblasts, and C2C12 myotubes to the above listed ligands, as well as p‐SMAD1/5/8 response to BMP4, BMP6, and BMP7.
= 4 for all data points.