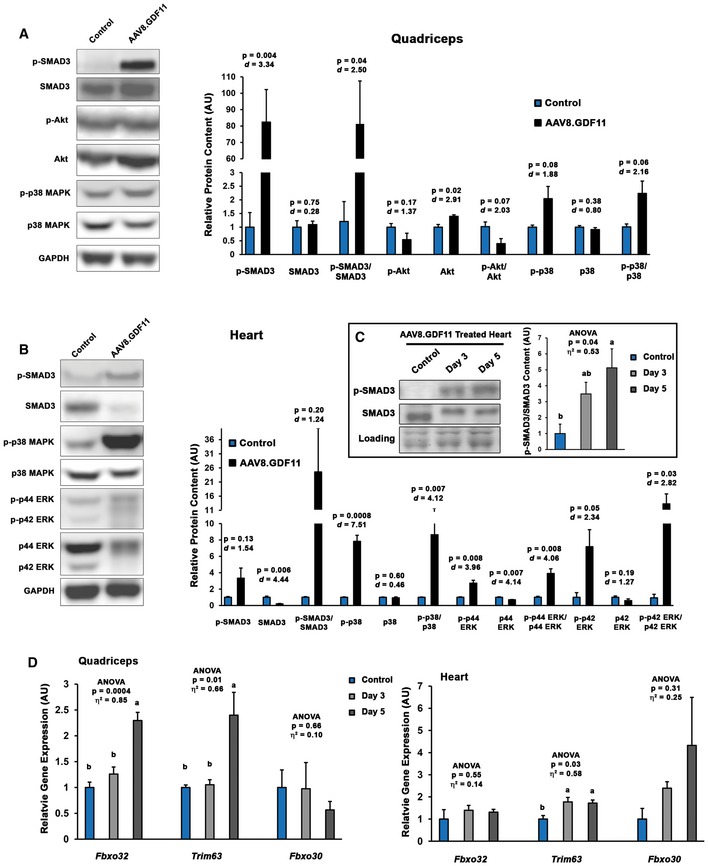
Immunoblotting data from quadriceps of PBS (control; n = 3) and liver‐specific GDF11 (AAV8.GDF11; n = 3)‐treated male C57BL/6 mice for phosphorylated and total forms of SMAD3, Akt, and p38 MAPK. Loading is normalized by GAPDH content and quantified relative to control values.
Immunoblotting data for phosphorylated and total forms of SMAD3, p38 MAPK, and p42/p44 ERK in the hearts of control and AAV8.GDF11‐treated male C57BL/6 mice. Loading is normalized by GAPDH content and quantified relative to control values.
Phosphorylation status of SMAD3 in the hearts of control (n = 3) and AAV8.GDF11‐treated male C57BL/6 mice at 3 days (n = 4) and 5 days (n = 4) following injection. Loading is normalized by Ponceau Red staining and quantified relative to control values.
Gene expression of Fbxo32 (MAFbx gene), Trim63 (MuRF1 gene), and Fbxo30 (MUSA‐1 gene) in the quadriceps (left) and heart (right) of control (n = 3) and AAV8.GDF11‐treated male C57BL/6 mice at 3 days (n = 4) and 5 days (n = 4) following injection. Relative gene expression values were calculated by the ΔΔCt method using Gapdh as the reference gene.
Data information: Values depicted are mean ± SEM. In (A, B), statistical analysis was performed using two‐tailed Student's
t‐test with effect size presented as Cohen's
d (
d). In (C, D), statistical analysis was performed using one‐way ANOVA analysis with Tukey's HSD
post hoc test (non‐connecting letters indicate
P < 0.05 between groups) and effect size presented as eta‐squared (η
2).