
Figure EV5. Lower expression levels of GDF11 induce loss of body weight and muscle atrophy.
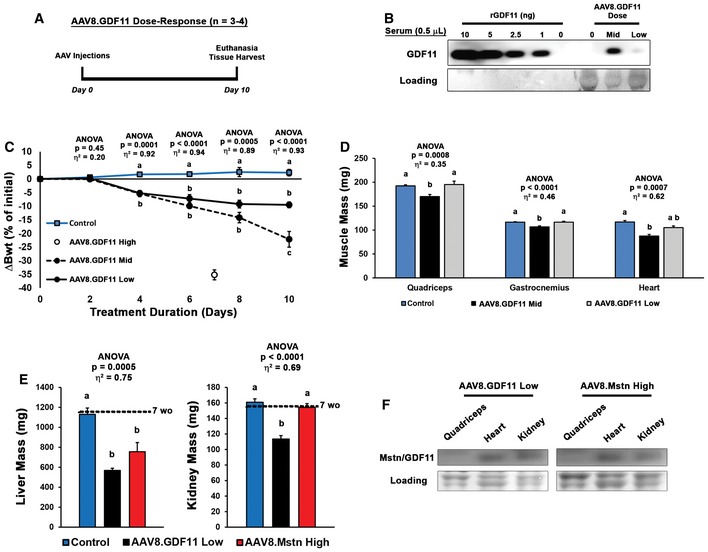
- Eleven‐week‐old C57BL/6 male mice received i.p. injections of PBS (control; n = 4), 1 × 10¹¹ gc of AAV8.GDF11 (mid dose; n = 3), or 5 × 10¹⁰ gc of AAV8.GDF11 (low dose; n = 3), and their body weights were monitored every other day until the 1 × 10¹¹ gc AAV8.GDF11 group required euthanasia on day 10.
- Immunoblotting of serum samples for GDF11 demonstrates expression levels of 0.5–1.6 ng/μl and 0.26–0.43 ng/μl for the mid‐ and low‐dose groups, respectively.
- Change in mouse body weights (Bwt) across the 10‐day study by the AAV8.GDF11 treatment groups, including terminal values for the previous 7‐day cohort treated with 1 × 10¹² gc of AAV8.GDF11 (high dose).
- Mass of the quadriceps, gastrocnemius, and heart of the 10‐day study mice (n = 12 for control mice by the inclusion of untreated age‐matched mice, resulting in a larger, homogenous data set).
- Liver and kidney mass of 7‐week‐old C57BL/6 male mice were treated with PBS (control; n = 5), AAV8.GDF11 low dose (n = 4), or AAV8.Mstn high dose (n = 5) for 16 days (see Fig 6B). The mean values for 7‐week‐old mice from this colony (n = 5) are indicated by the dotted line to show starting masses.
- Immunoblotting comparison of monomeric GDF11 and Mstn levels in quadriceps, heart, and kidney demonstrate that differential effects are not due to differential accumulation of the ligands in tissue.