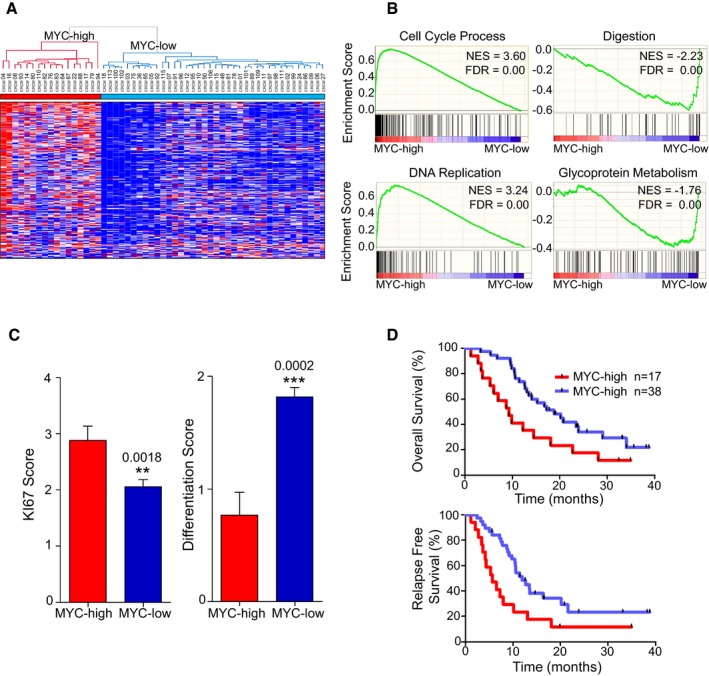
Figure 1. Identification of a c‐MYC transcriptional signature in 55 pancreatic cancer‐derived xenografts.

- Hierarchical clustering and expression heatmap analyzed by a non‐supervised method. MYC‐high and MYC‐low subgroups present different expression patterns based on the selected 239 probe sets corresponding to MYC target genes (Hugene 2.0 ST Array, Affymetrix Genechips). MYC‐high (n = 17 patients) and MYC‐low (n = 38 patients). RMA normalized gene expression is represented in color to indicate relative gene expression (high in red, low in blue).
- GSEA analysis of RMA normalized gene expression. Top score biological process significantly different between both groups (MYC‐high and MYC‐low) are represented; 825 gene sets from MSigDB collections were used. NES is the normalized enrichment score, and FDR corresponds to the false discovery rate.
- Ki67 expression level and differentiation degree: Samples were determined by IHC and scored from 0 to 4 for Ki67 staining (0 corresponding to negative staining and 4 to maximal staining) and from 0 to 2 for differentiation state (0 corresponding to the lowest and 2 to the maximal differentiation). Pictures representing the different scores are provided in the Appendix. **P = 0.0018; ***P = 0.0002 (mean ± SEM, n = 17 vs. 38, unpaired t‐test two‐tailed).
- Kaplan–Meier curves showing the overall (upper graph) and relapse‐free survival (lower graph) for MYC‐high and MYC‐low subgroups. The P‐values were calculated using log‐rank test.
Source data are available online for this figure.
