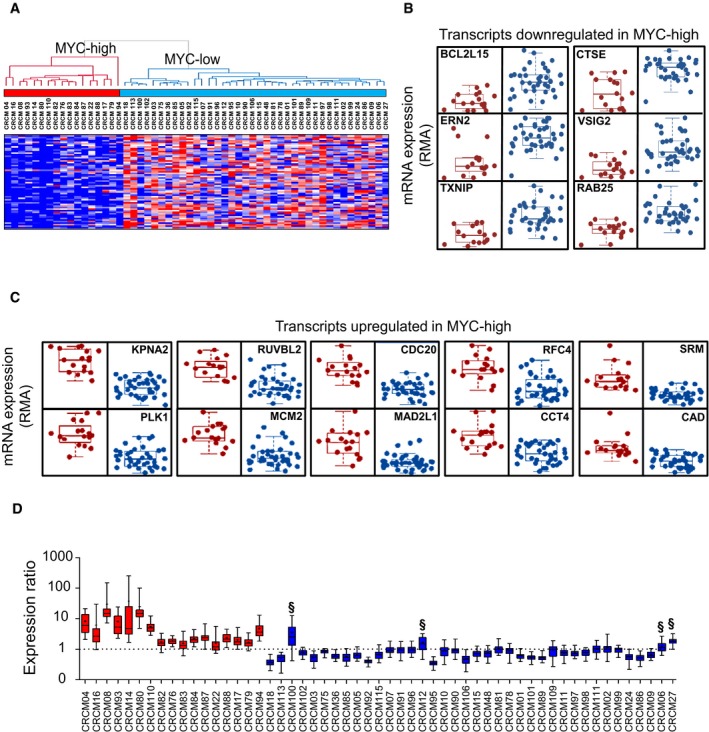
Figure 2. Determination of a set of 16 genes specific for MYC .

-
AHierarchical clustering and expression heatmap for the top significantly low‐expressed genes in MYC‐high patients. Sixty transcripts were ranked (P = 0.01996; Wilcoxon t‐test). Data correspond to RMA normalized expression values. Red and blue colors represent relative gene expression as in Fig 1A.
-
B, CBox plots of the sixteen selected markers for the MYC‐associated signature. In (B) are plotted the six selected transcripts that are downregulated in the MYC‐high patient group, this set was selected from the 60 transcripts indicated in (A) (P = 0.01996 and FDR ≤ 0.044). In (C) are plotted the set of 10 MYC target transcripts upregulated in MYC‐high patients which was selected from the 239 transcripts indicated in Fig 1A (P = 0.01996 and FDR ≤ 0.044).
-
DBox plots representing the normalized expression ratios (see Materials and Methods) for the sixteen selected transcripts in the MYC‐associated signature. Ratios were done with transcriptomic data obtained from the 55 patients used to select the MYC signature (training cohort). Ratios > 1 indicate a MYC‐high profile, and ratios < 1 correspond to MYC‐low profile. § symbols indicate the four false positives detected with the signature (duplicates [2 chips/PDX]).
