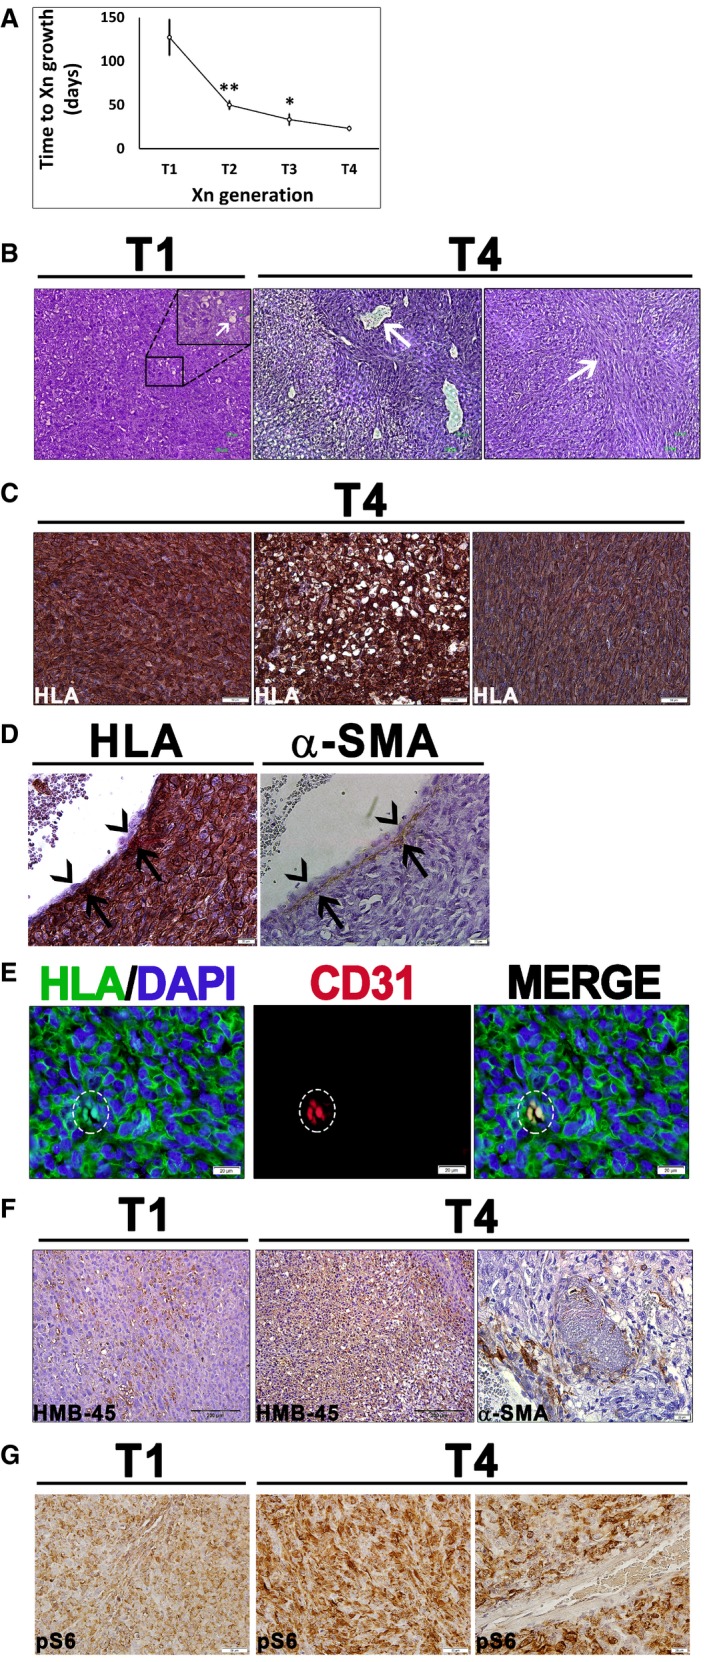
Growth interval between sequential Xn generations from 1
st (T1) to 4
th (T4), shown as mean ± SD (
n ≥ 3); *
P < 0.05; **
P < 0.01 (one‐way ANOVA with Bonferroni
post hoc test). The exact
P‐values are specified in
Appendix Table S5.
T1‐Xn harbor mainly undifferentiated cells with rare lipid‐distended cells (arrows). In contrast, T4‐Xn show the classic triphasic AML histology, consisting of vessels (left panel, arrow) surrounded by a thick layer of perivascular epithelioid cell (PEC)‐like cells. Peripherally, a lipoid area, composed of lipid‐distended cells, is seen. Furthermore, T4‐Xn harbor “myoid” areas (right panel, arrow), composed of immature myocytes. Scale bar: 100 μm.
Immunohistochemical staining (IHC) of T4‐Xn for HLA, showing positive staining of the undifferentiated, lipoid, and myoid (left, middle, and right panels, respectively) compartments. Scale bar: 50 μm.
IHC of T4‐Xn for HLA (left panel) and pericyte marker α‐SMA (right panel). Shown is a vessel, in which α‐SMA+ pericytes are HLA+ (arrows), whereas endothelial cells are of mouse origin (arrowheads). Scale bar: 100 μm.
Immunofluorescent staining (IF) of T4‐Xn for HLA (green) and CD31 (red), demonstrating formation of human‐derived vessels. Scale bar: 20 μm.
IHC of T1‐ and T4‐Xn for the diagnostic AML markers HMB‐45 and α‐SMA. HMB‐45 is expressed in both T1‐ (left panel) and T4‐Xn (middle panel) and stains both blood vessels and adipocytes. Scale bar: 200 μm. In contrast, only T4‐Xn express α‐SMA (right panel). Scale bar: 20 μm.
IHC of T1‐ and T4‐Xn for pS6, demonstrating expression in both T1‐ (left panel) and, to a greater extent, T4‐Xn (middle panel). Scale bar: 50 μm. Note that within tumor vessels, only perivascular cells express pS6 (right panel). Scale bar: 20 μm.

