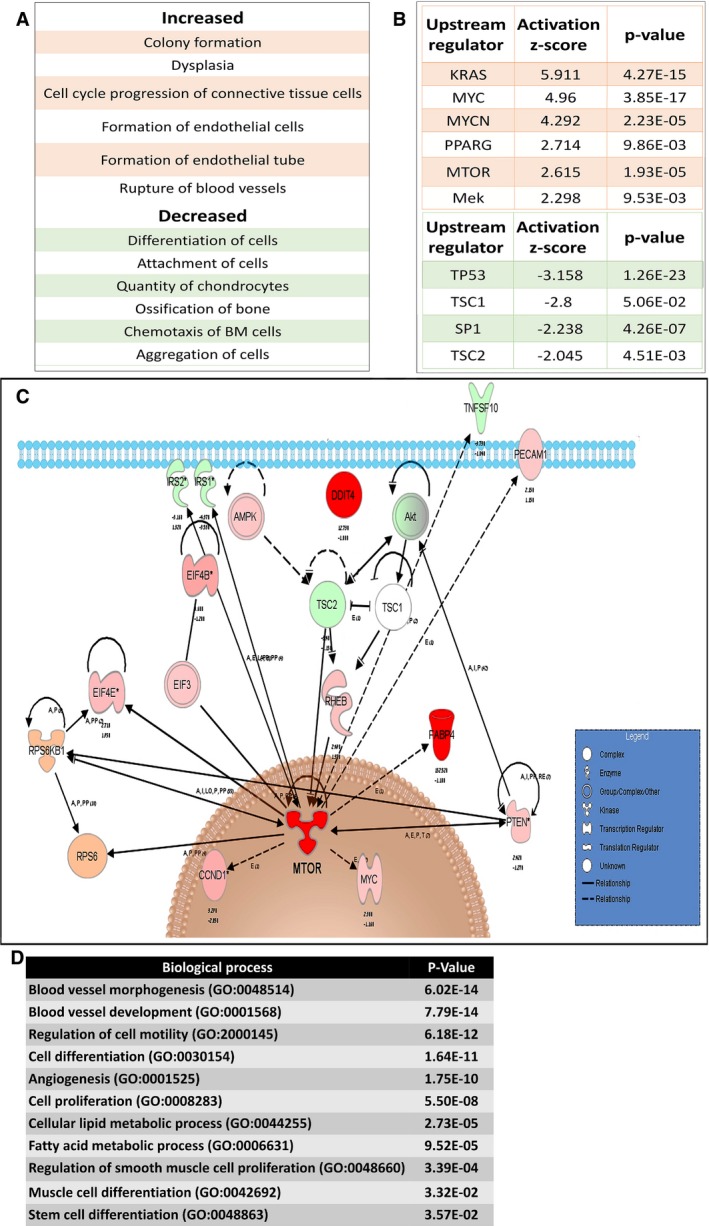
Figure 2. Microarray analysis of AML xenografts (Xn).

- Ingenuity Pathway Analysis (IPA) of increased (upper panel) and decreased (lower panel) functions in T5 (5th generation)‐ versus T1 (1st generation)‐Xn.
- Activated (upper panel) and inhibited (lower panel) upstream regulators in T5‐ versus T1‐Xn according to IPA.
- IPA of the mTOR pathway according to gene expression changes in T5‐ versus T1‐Xn. Red/pink indicates increased gene expression, and green indicates decreased expression. *MTOR demonstrated activation as an upstream regulator with an activation z‐score of 2.615 and a P‐value of 1.93E‐05.
- Enriched Gene Ontology (GO) biological processes according to differentially expressed genes in T5‐Xn compared to normal human kidneys.
