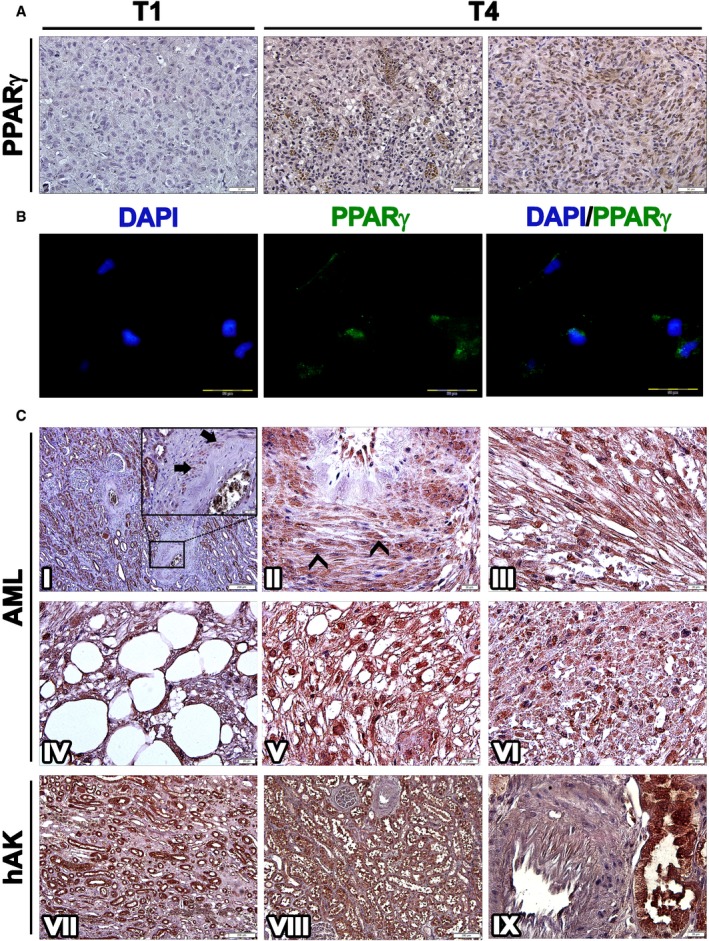
Figure 3. PPARG is strongly expressed in human AML .

- Immunohistochemical staining (IHC) of T1 (1st generation)‐ and T4 (4th generation)‐xenografts (Xn) for PPARG. T1‐Xn (left panel) demonstrate low expression of PPARG. In contrast, T4‐Xn are strongly positive for PPARG. Abundant expression is seen both in adipocytic cells (middle panel) and in the undifferentiated non‐adipocytic compartment of the tumor (right panel), where strong nuclear staining can be noted. Scale bar: 50 μm.
- Immunofluorescent staining of T4‐Xn cells for PPARG (green), demonstrating both cytoplasmic and nuclear expression. Scale bar: 100 μm.
- IHC of primary AML tumors for PPARG. Normal renal tissue of the patient (I) demonstrates strong PPARG expression in tubules and endothelial cells and lack of expression in glomeruli. In vessel walls (magnified in I), PPARG expression can be noted in a small portion of pericytes (arrows). Within tumor tissue, numerous pericytes strongly expressing PPARG are seen (II), demonstrating both nuclear (arrowheads) and cytoplasmic expression. PPARG is also strongly expressed in the myoid and adipocytic compartments of the tumor (III and IV, respectively). Particularly strong nuclear expression is seen in epithelioid cells (V). Scattered within the tumor are small undifferentiated cells (VI), which are also positive for PPARG. Normal control human adult kidneys (hAK) demonstrate PPARG expression in all tubule segments, including collecting ducts (VII and VIII) but not in glomeruli. In contrast to normal and tumor tissue from AML patients, blood vessels in normal hAK do not harbor PPARG‐expressing pericytes (IX). Scale bars: II–VI, IX: 20 μm; I, VII, VIII: 200 μm.
