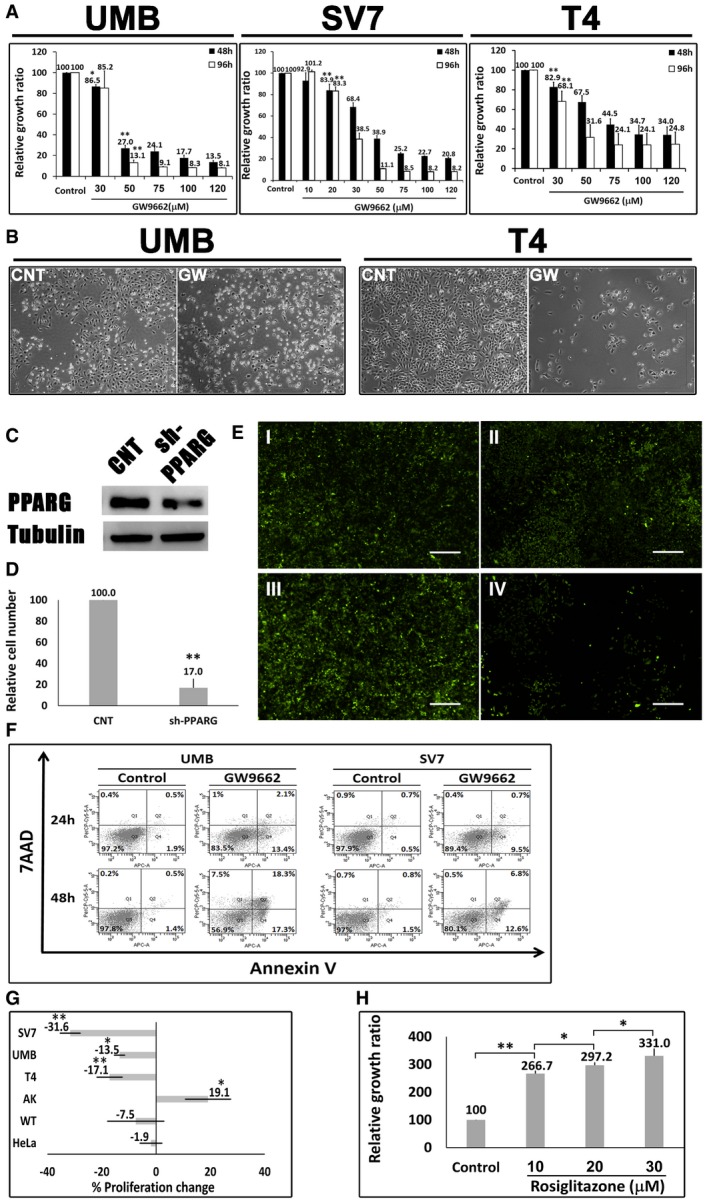
Relative growth ratios of UMB, SV7, and T4 (4th generation)‐xenograft (Xn) cells (left, middle, and right panels, respectively) treated with the PPARG inhibitor GW9662 in varying concentrations, compared to control, vehicle‐treated cells, shown as mean ± SD (n = 3). At each of the two time points, treated cells with a given concentration were compared to control cells. *P < 0.05, **P < 0.01 (one‐way ANOVA with Bonferroni post hoc test).
The effects of 48‐h treatment with GW9662 (GW) or vehicle (CNT) on the morphology of UMB (left panel) and T4‐Xn (right panel) cells. Scale bar: 1,000 μm.
PPARG knockdown (KD) results in growth inhibition of AML cells: UMB and SV7 cells were infected with shRNA targeting PPARG or control‐shRNA, both consisting of a GFP‐expressing cassette. Western blot analysis demonstrated significant reduction in PPARG protein levels following infection with PPARG‐shRNA (sh‐PPARG) compared to control‐shRNA (CNT).
In order to assess the effect of PPARG KD on cell growth, both UMB and SV7 cell lines were seeded in equal amounts and recounted following 1 week. PPARG KD resulted in a significant reduction in cell numbers. Results shown as mean ± SD (n = 3). **P < 0.01 (two‐tailed Student's t‐test).
Representative images of control‐ and PPARG‐shRNA‐infected cells, both marked by GFP, at day 0 and day 7, showing significant growth inhibition in the latter. I & II, control cells at day 0 and 7, respectively; III & IV, PPARG‐shRNA‐infected cells at day 0 and 7, respectively. Scale bars, 500 μm.
Flow cytometric analysis of UMB and SV7 cells treated with GW9662 or vehicle (control). Cells were treated for 24 or 48 h and analyzed for the expression of the early apoptosis marker annexin V and necrosis marker 7AAD.
Comparison of the anti‐proliferative effect of GW9662 on UMB, SV7, T4‐Xn, normal human adult kidney (AK), Wilms' tumor (WT), and the cervical cancer cell line HeLa, shown as percent change in proliferation. The cells were treated for 48 h with 30 μM GW9662. Results shown as mean ± SD (n = 3). *P < 0.05, **P < 0.01 (one‐way ANOVA with Bonferroni post hoc test).
Relative growth ratios of T5‐Xn cells treated with the PPARG agonist rosiglitazone for 96 h in varying concentrations, compared to control cells, shown as mean ± SD (n = 3). *P < 0.05, **P < 0.01 (one‐way ANOVA with Bonferroni post hoc test).
.

