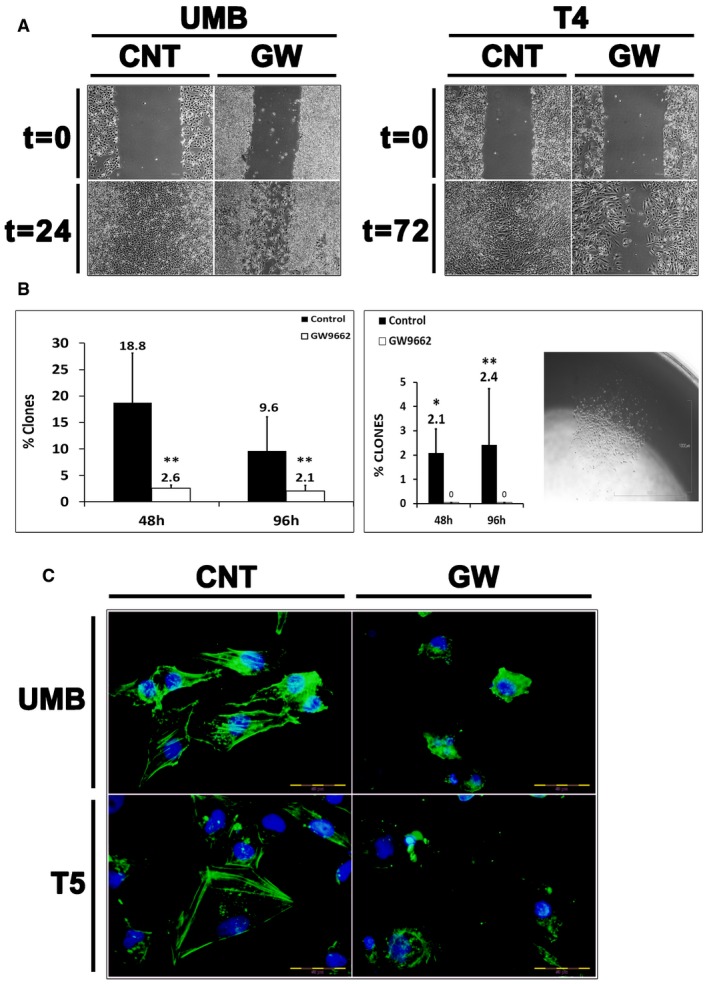
Figure 5. PPARG inhibition damages AML cells at the structural and functional levels.

- Cell migration assay demonstrating the effects of PPARG inhibition on cell migration. UMB and T4 (4th generation)‐xenograft (Xn) cells were treated with GW9662 (GW) or vehicle (CNT) and assessed for their ability to migrate through a scrape in the cell monolayer. Both UMB (left panel) and T4‐Xn cells (right panel) demonstrated significantly lower migration capacity as a result of the treatment, compared to control cells. Scale bar: 1,000 μm.
- Comparison of the single‐cell‐derived colony formation capacity of UMB (left panel) and T4‐Xn cells (right panel) treated with GW9662 or vehicle (control). Shown in the picture is a representative colony derived from a T4‐Xn cell. Results shown as the mean percentage of cells that formed clones ± SD (n = 3). *P < 0.05; **P < 0.01 (chi‐squared test). Scale bar: 1,000 μm. The exact P‐values are specified in Appendix Table S5.
- Immunofluorescent staining for β‐actin (green) in UMB (top panel) and T5‐Xn cells (bottom panel) treated with GW9662 (GW) or vehicle (CNT), demonstrating changes in the cytoskeleton as a result of the treatment. Scale bar: 50 μm.
