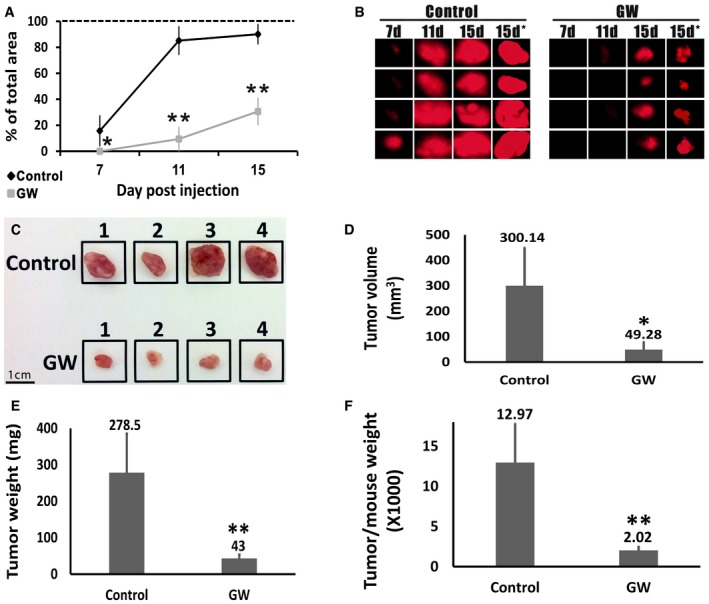
mCherry‐labeled AML‐Xn cells were treated for 24 h with GW9662 or vehicle, after which 50,000 living cells, as determined by negative staining for trypan blue, of each group, were injected into four mice. Tumor burden was visualized at post‐injection day 7 and every 4 days thereafter, using a fluorescent binocular and quantified as the percentage of visualized field occupied by the tumor.
-
A
Relative size of tumors derived from control‐ and GW9662‐treated (GW) cells, as assessed by in vivo imaging. Size shown as percentage of the visualization field in the fluorescent binocular occupied by the tumor. Results shown as mean ± SD (n = 4). *P < 0.05; **P < 0.01 (two‐tailed Student's t‐test).
-
B
Photographs of the mCherry‐expressing tumors obtained using a fluorescent binocular at 7, 11, and 15 days after injection and immediately after tumor resection (7, 11, 15, and 15 days*, respectively). Photographs taken at 0.7× magnification.
-
C
Photographs of the tumors derived from control and GW9662‐treated (GW) cells, immediately following resection. Scale bar: 1 cm.
-
D–F
Comparison of the tumors derived from control and GW9662‐treated (GW) cells in terms of tumor volume, tumor weight, and tumor weight to mouse weight. Results shown as mean ± SD (n = 4). *P < 0.05; **P < 0.01 (two‐tailed Student's t‐test).
Data information: The exact
P‐values are specified in
Appendix Table S5.

