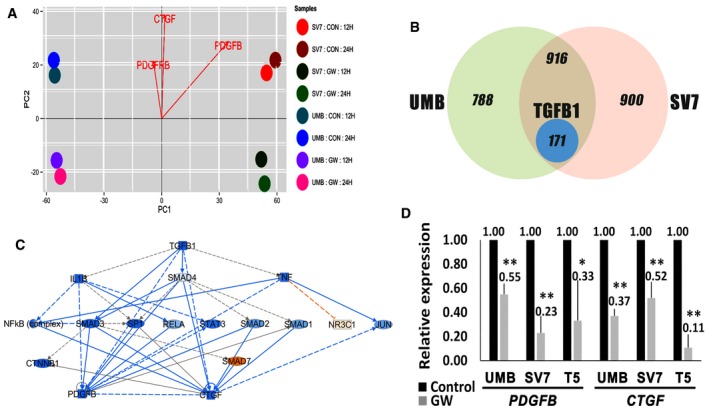
Figure 7. PPARG inhibition induces AML cell death via TGFB1‐mediated inhibition of PDGFB and CTGF .

- Principal components analysis (PCA) of differentially expressed genes in UMB and SV7 cells treated with GW9662 (GW) for 12 or 24 h compared to control cells (CON). Notably, PDGFB, PDGFRB, and CTGF demonstrate significantly stronger expression in control samples.
- Venn diagram demonstrating the effect of PPARG inhibition on global gene expression of UMB and SV7 cells. The left and right circles represent the number of genes exhibiting a fold change of ≥ 2 as a result of PPARG inhibition in UMB and SV7 cells, respectively, while the intersection area represents the common differentially expressed genes. The blue circle represents the TGFB1‐related genes contained within the latter.
- IPA of TGFB1‐regulated genes demonstrating a fold change of ≥ 2 as a result of PPARG inhibition. Blue and red circles represent inhibited and activated upstream regulators, respectively.
- qPCR analysis of PDGFB and CTGF in UMB, SV7, and T5‐Xn cells treated with GW9662 (GW) compared with control cells. Results shown as mean ± SD (n = 4). *P < 0.05; **P < 0.01 (two‐tailed Student's t‐test). The exact P‐values are specified in Appendix Table S5.
