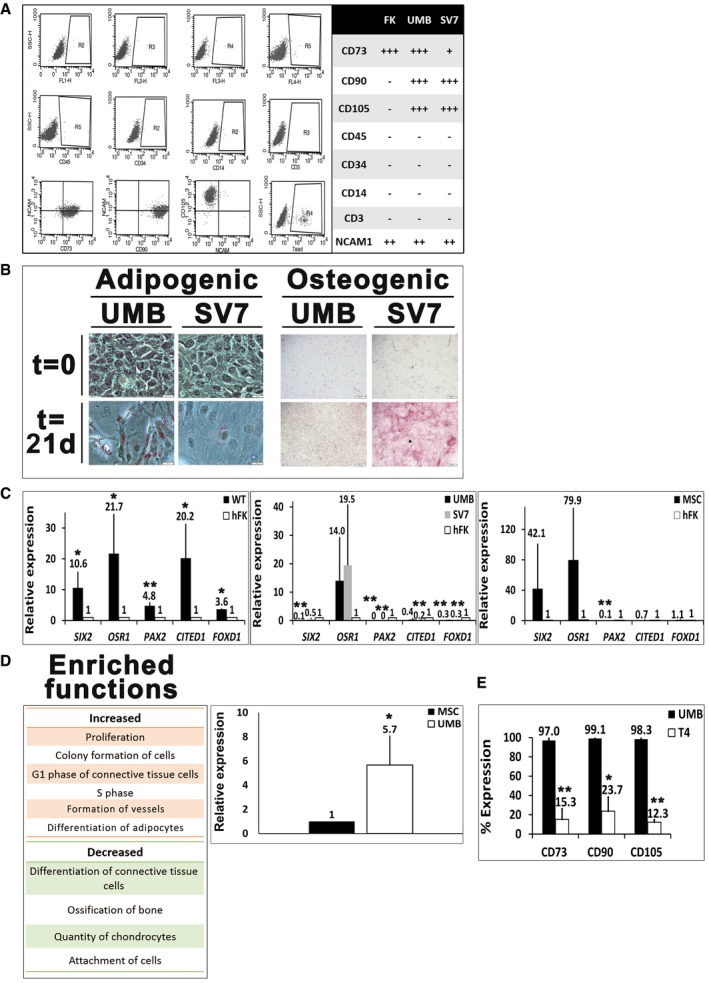
Flow cytometry analysis of human fetal kidney (hFK), UMB, and SV7 cells. Left panel: Representative dot plots of UMB cell expression of CD45, CD34, CD14, CD3, CD105, CD73, CD90, neural cell adhesion molecule 1 (NCAM1), and unstained controls. Right panel: Summary of expression levels. +++, strong; ++, medium; +, low; −, no staining.
Left: Oil Red O staining of UMB and SV7 cells before (t = 0) and after (t = 21 days) induction of adipogenic differentiation, demonstrating formation of lipid vacuoles. Scale bar: 50 μm. Right: Alizarin red staining of UMB and SV7 cells before (t = 0) and after (t = 21 days) induction of osteogenic differentiation, demonstrating formation of calcium deposits. Scale bar: 500 μm.
Left panel: Quantitative PCR (qPCR) analysis, demonstrating significant upregulation of renal progenitor genes in Wilms' tumor (WT) cells compared to hFK cells (hence = 1). Middle panel: qPCR analysis of renal progenitor gene expression, demonstrating higher OSR1 expression in UMB and SV7 cells and comparable SIX2 expression in SV7 compared to hFK (hence = 1). Other renal progenitor genes and the stromal progenitor gene FOXD1 exhibit low expression levels. Right panel: qPCR analysis of renal progenitor gene expression in human MSCs compared to hFK (hence = 1), demonstrating a similar expression pattern to AML cells. Results shown as mean ± SD (n = 3). *P < 0.05; **P < 0.01 (two‐tailed Student's t‐test).
Left panel: Ingenuity Pathway Analysis (IPA) of increased and decreased functions in UMB cells compared to MSCs. Right panel: qPCR analysis of PPARG expression in UMB cells compared with MSCs (hence = 1). Results shown as mean ± SD (n = 3). *P < 0.05 (two‐tailed Student's t‐test).
Comparison of MSC marker expression between UMB and T4 (4th generation)‐xenograft (Xn) cells. A significant decrease in the expression of CD73, CD90, and CD105 is seen. Results shown as mean ± SD (n = 3).*P < 0.05; **P < 0.01 (two‐tailed Student's t‐test).
.

