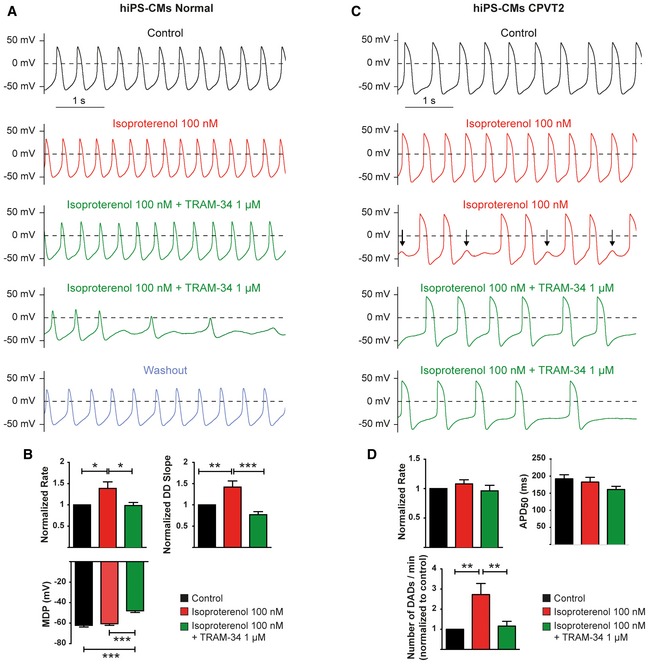
Representative traces of spontaneous APs recorded in a hiPSC‐CM derived from a normal individual under the indicated conditions.
Histograms of statistical data of the beating rate, DD slope, and MDP of hiPSC‐CMs from a normal individual. One‐way ANOVA followed by Tukey's multiple comparison test. For rate (normalized to Control), *P < 0.05, n = 24; for DD slope (normalized to Control), **P < 0.01 and ***P < 0.0001, n = 24; for MDP, ***P < 0.0001, n = 24. Bars and error bars are mean ± SEM.
Representative traces of spontaneous APs recorded in a hiPSC‐CM derived from a CPVT2 patient under the indicated conditions.
Histograms of statistical data of the beating rate, APD50, and DADs of hiPSC‐CMs from a CPVT2 patient. One‐way ANOVA followed by Tukey's multiple comparison test. For the rate, P = ns, n = 21; for the APD50, P = ns, n = 19; for the DADs, **P < 0.01, n = 19. Bars and error bars are mean ± SEM.

