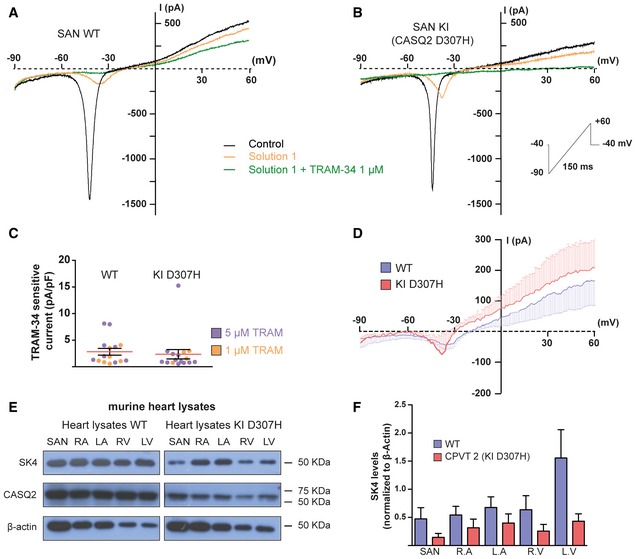
Figure 3. SK4 channels are expressed in SAN cells from WT and CASQ2‐D307H KI mice.

- Representative traces of a SAN cell from WT mice following a voltage ramp under the indicated conditions.
- Representative traces of a SAN cell from CASQ2‐D307H KI mice.
- Scatter plot of the TRAM‐sensitive current densities measured at +60 mV with 1 or 5 μM TRAM‐34. Current densities were 2.82 ± 0.63 pA/pF in WT (n = 15) and 2.36 ± 0.89 pA/pF in CASQ2‐D307H KI mice (n = 16). Not statistically different (two‐tailed unpaired t‐test).
- Average traces of the TRAM‐34‐sensitive currents using 1 μM TRAM‐34 of WT (n = 7) and CASQ2‐D307H KI mice (n = 4). For clarity, the SEM bars are shown for every mV.
- Representative Western blots of heart lysates from WT and CASQ2‐D307H KI mice showing the immunoreactive bands of SK4, CASQ2, and β‐actin proteins in SAN, right and left atrial appendages, and right and left ventricles.
- Quantification of the SK4 channel immunoreactive protein (normalized to β‐actin) in different heart regions (n = 3). Not statistically different (two‐tailed unpaired t‐test). Error bars are SEM.
Source data are available online for this figure.
