
Figure 1. Integrated metabolic analysis of MYC‐driven liver tumors.
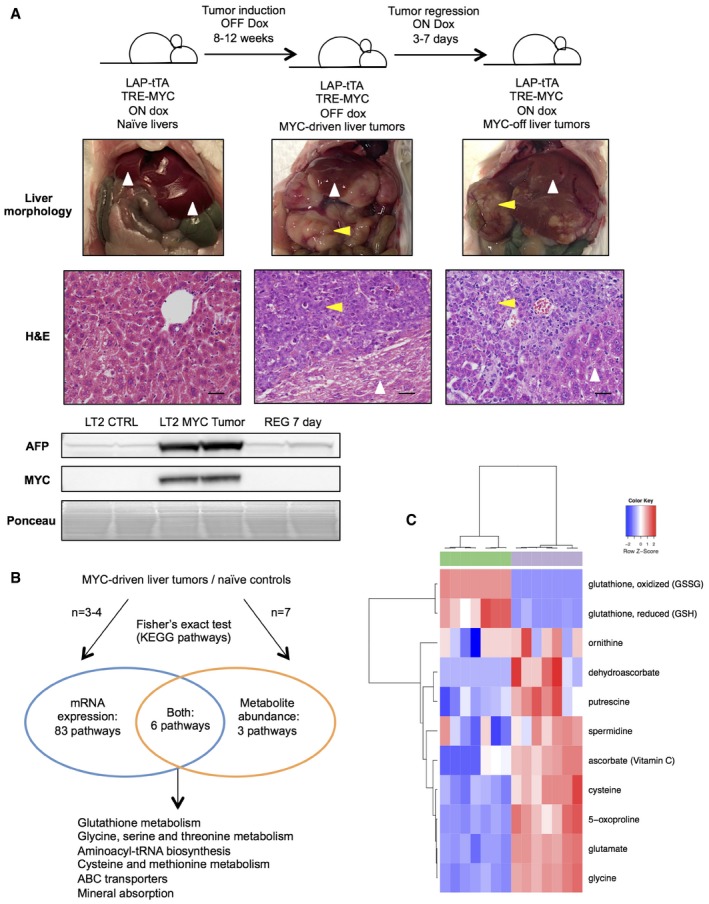
- Summary of LT2‐MYC conditional transgenic mouse model of MYC‐induced hepatocarcinogenesis. Prolonged MYC overexpression induces tumor nodules that are morphologically and histologically distinct from non‐tumor tissue. MYC protein expression can be turned off in established tumors and correlates with alpha‐fetoprotein (AFP) expression, a marker of aggressive liver cancer (see REG 7 day Western blot). In images, white arrows indicate non‐tumor liver tissue and yellow arrows indicate liver tumor tissue. Scale bars in hematoxylin and eosin‐stained (H&E) sections represent 20 μm.
- Transcriptional and biochemical profiling analyses identify six pathways that are significantly altered in LT2‐MYC tumors versus control livers (n = 3 LT2 control and n = 4 LT2‐MYC for transcriptional profiling, n = 7 in each group for biochemical profiling, Fisher's exact test, P < 0.05).
- Glutathione pathway (KEGG #ko00480) metabolite abundances segregate LT2‐MYC tumors from control livers by unsupervised hierarchical clustering (n = 7 in each group, LT2 control liver samples in green, LT2‐MYC tumor samples in gray).
Source data are available online for this figure.