
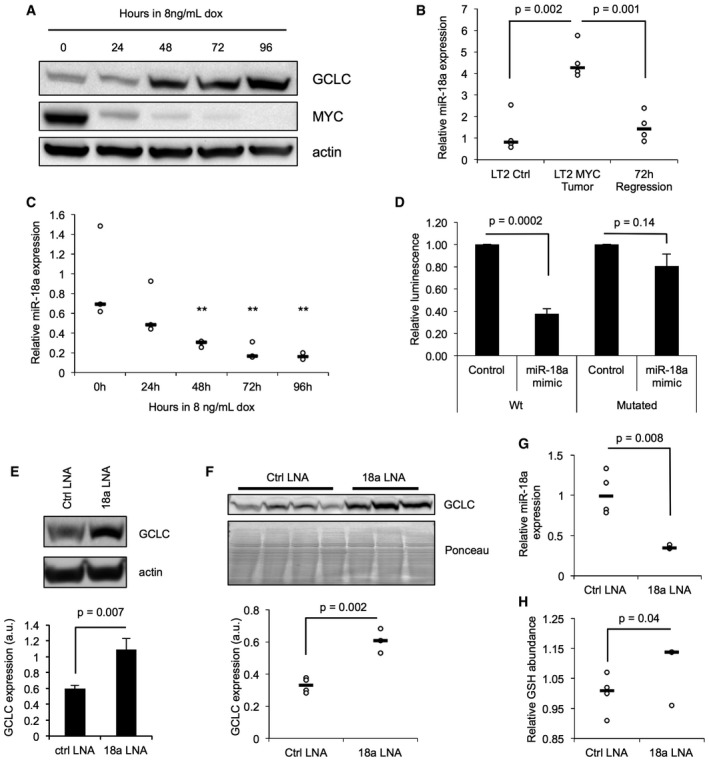
Figure 3. GCLC is attenuated by miRNA‐18a in MYC‐driven liver tumors.
-
AWestern blot analysis of GCLC and MYC protein expression in conditional liver tumor cells derived from an LT2‐MYC tumor (Western blot is representative of a minimum of four experimental replicates).
-
BQuantitative PCR (qPCR) analysis of miR‐18a expression in LT2‐MYC tumors, control liver tissues, and tumors regressed for 3 days (n = 4 each group, data represented as univariate scatter plot with median, unpaired two‐tailed t‐test, LT2 ctrl versus LT2‐MYC tumor P = 0.002, LT2‐MYC tumor versus 72 h regression tumors P = 0.001).
-
CqPCR analysis of miR‐18a expression in conditional liver tumor cells treated with doxycycline (data represented as univariate scatter plot with median, data points represent three experimental replicates comprised of three technical replicates each, unpaired two‐tailed t‐test; compared to 0 h: 24 h, P = 0.14; 48 h, P = 0.008; 72 h, P = 0.005; 96 h, P = 0.003, **P‐values for 48 h, 72 h, and 96 h fall below Bonferroni adjusted P‐value of 0.01).
-
DLuciferase reporter expression in cultured murine liver tumor cells treated with a miR‐18a mimic or control. Wt, wild‐type Gclc 3′ UTR; mutated, Gclc 3′ UTR with four base pairs of the putative miR‐18a binding site mutated (data represented as normalized mean ± SEM of three experimental replicates with three technical replicates each, unpaired two‐tailed t‐test, Wt UTR ctrl versus 18a mimic P = 0.0002, mutated UTR control versus 18a mimic P = 0.14).
-
EWestern blot (WB) analysis of GCLC protein expression following treatment of cultured LT2‐MYC liver tumor cells with locked nucleic acid (LNA) inhibitors of miR‐18a (WB representative of two experimental replicates with three technical replicates each, pooled data represented as mean ± SEM, unpaired two‐tailed t‐test, P = 0.007).
-
F–HWB of GCLC protein expression (F), qPCR of miR‐18a expression (G), and enzymatic quantitation of GSH abundance (H) in liver tissue samples following treatment of LT2‐MYC tumor‐bearing mice with LNA inhibitors of miR‐18a or control LNA (n = 4 control LNA, n = 3 18a LNA, data represented as univariate scatter plots with median, unpaired two‐tailed t‐test, WB P = 0.002; qPCR P = 0.008; GSH assay P = 0.04).
Source data are available online for this figure.