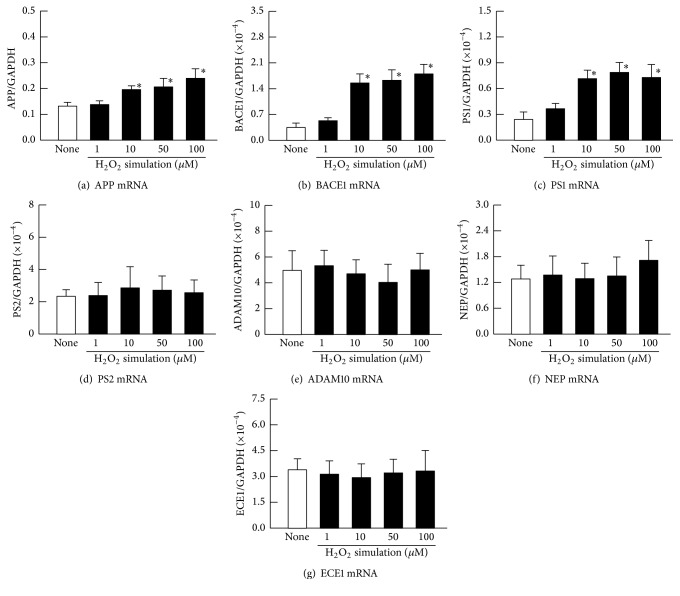
Figure 2.
Effect of H2O2 stimulation on mRNA levels of APP (a), BACE1 (b), PS1 (c), PS2 (d), ADAM10 (e), NEP (f), and ECE1 (g) in HLE cells. The HLE cells were stimulated with 1–100 μM H2O2 for 24 h. Open columns (none) = unstimulated HLE cells. Closed columns = H2O2-stimulated HLE cells. The data are presented as the means ± SE of 5–8 experiments. ∗P < 0.05, versus none for each category.

