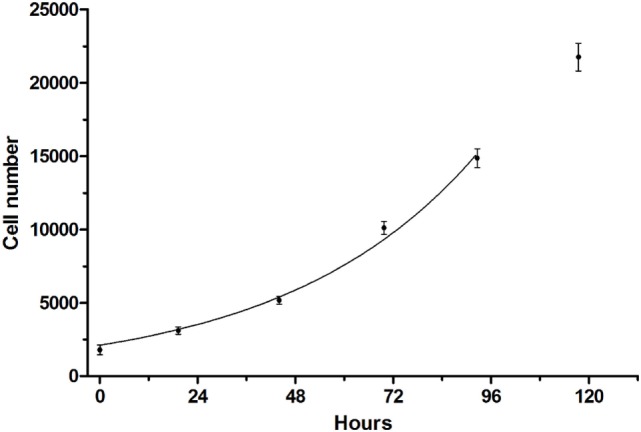
Figure 1.

Growth curve of CS242 embryonal rhabdomyosarcoma cell line optimized for screening. Cells plated at 1,250/well in 384-well format were assessed for viability using CellTiter-Glo at the times shown. Raw luminescence data were converted to cell number using a standard curve, and data up to 96 h were fit to an exponential growth curve using the exponential growth equation in GraphPad Prism. Data points represent mean ± SD of 48 (0 h) or 32 replicates (remaining time points).
