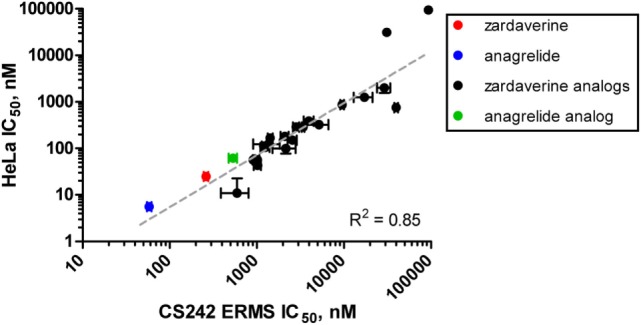
Figure 6.

Correlation of rank-order compound potency between CS242 embryonal rhabdomyosarcoma (ERMS) and HeLa cells. Anagrelide, zardaverine, and analogs (structures shown in Figure 3) were tested in dose–response for their effects on viability on CS242 ERMS and HeLa cells. Calculated IC50 values are listed in Table 4. Each point on the graph represents one compound, plotted according to IC50 in CS242 ERMS (x-axis) and IC50 in HeLa cells (y-axis). Data represent mean ± SD for three replicates. (No error bars are shown for the two compounds in the top right-hand corner of the graph because the IC50 values were outside the range of compound concentrations tested. In these cases, the x–y coordinates of the data points shown represent the top concentration tested in each cell line.) Linear regression revealed a highly significant correlation (R2 = 0.85).
