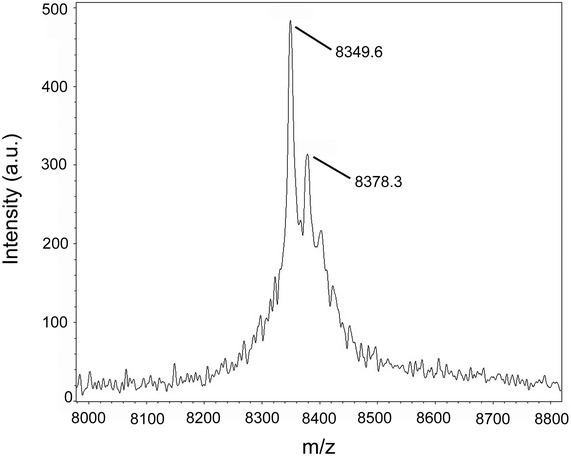
Figure EV1. MALDI mass spectrum of purified Burkholderia pseudomallei c‐subunit.

Peaks were identified at 8,349.6 m/z and 8,378.3 m/z, corresponding to the molecular mass of unformylated (predicted 8,349.96 Da) or formylated (predicted 8,377.96 Da) B. pseudomallei c‐subunit.
