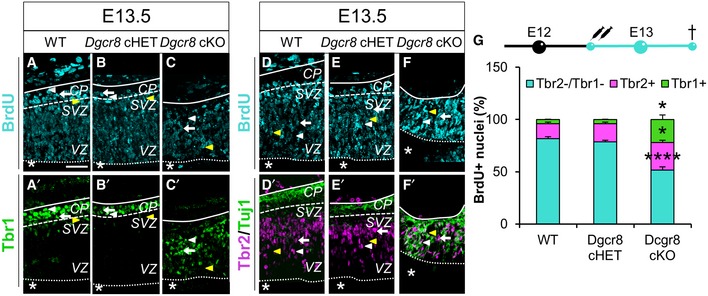
Immunofluorescence microscopy of coronal cryosections through the dorsal telencephalon of E13.5 WT (A, A’, D, D’),
Dgcr8 cHET (B, B’, E, E’), and
Dgcr8 cKO (C, C’, F, F’) littermate mouse embryos, subjected to two BrdU administrations from E12.5. Double immunostaining for BrdU (A–F, cyan) and Tbr1 (A’–C’, green), or triple immunostaining for BrdU, Tbr2 (D’–F’, magenta), and Tuj1 (D’–F’, green). Arrowheads and arrows indicate categories of counted cells as shown in
Appendix Fig S3. Asterisks indicate the ventricular lumen. Solid and dashed lines indicate cortex boundaries. Cortical plate (CP); subventricular zone (SVZ); ventricular zone (VZ). Scale bars: 50 μm.