-
A–C
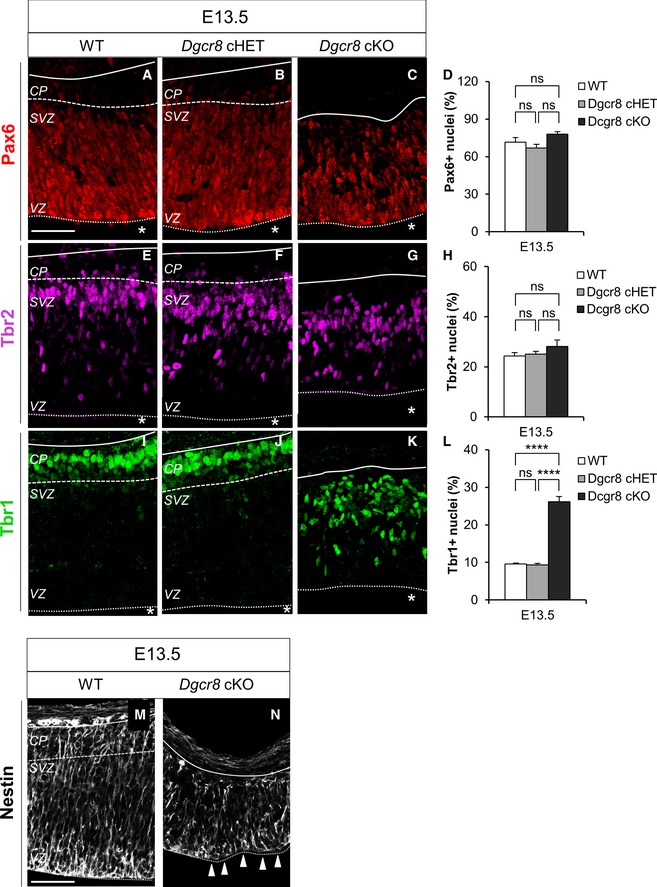
Immunofluorescence microscopy of coronal cryosections through the dorsal telencephalon of E13.5 WT (A), Dgcr8 cHET (B), and cKO (C) littermate mouse embryos, showing Pax6 (red) staining.
-
D
Quantification of the proportion of Pax6+ apical progenitors in the images shown in (A–C), expressed as a percentage of the total Hoechst‐stained nuclei (not shown).
-
E–G
Immunofluorescence microscopy of coronal cryosections through the dorsal telencephalon of E13.5 WT (E), Dgcr8 cHET (F), and cKO (G) littermate mouse embryos, showing Tbr2 (magenta) staining.
-
H
Quantification of the proportion of Tbr2+ basal progenitors in the images shown in (E–G), expressed as a percentage of the total Hoechst‐stained nuclei (not shown).
-
I–K
Immunofluorescence microscopy of coronal cryosections through the dorsal telencephalon of E13.5 WT (I), Dgcr8 cHET (J), and cKO (K) littermate mouse embryos, showing Tbr1 (green) staining.
-
L
Quantification of the proportion of Tbr1+ neurons in the images shown in (I–K), expressed as a percentage of the total Hoechst‐stained nuclei (not shown).
-
M, N
Immunostaining for Nestin+ radial glia cells through the dorsal telencephalon of E13.5 WT (M) and Dgcr8 cKO (N) littermate mouse embryos. White arrowheads indicate the disruption of the apical surface organization of the radial glia.
Data information: Scale bars: 50 μm. Asterisks indicate the ventricular lumen. Solid and dashed lines indicate cortex boundaries. Cortical plate (CP); subventricular zone (SVZ); ventricular zone (VZ). Apoptotic nuclei are excluded from all quantifications. Bars are mean ± SEM of three embryos per condition (18 counted fields per condition). One‐way ANOVA, ****
< 0.0001; n.s., not significant.