-
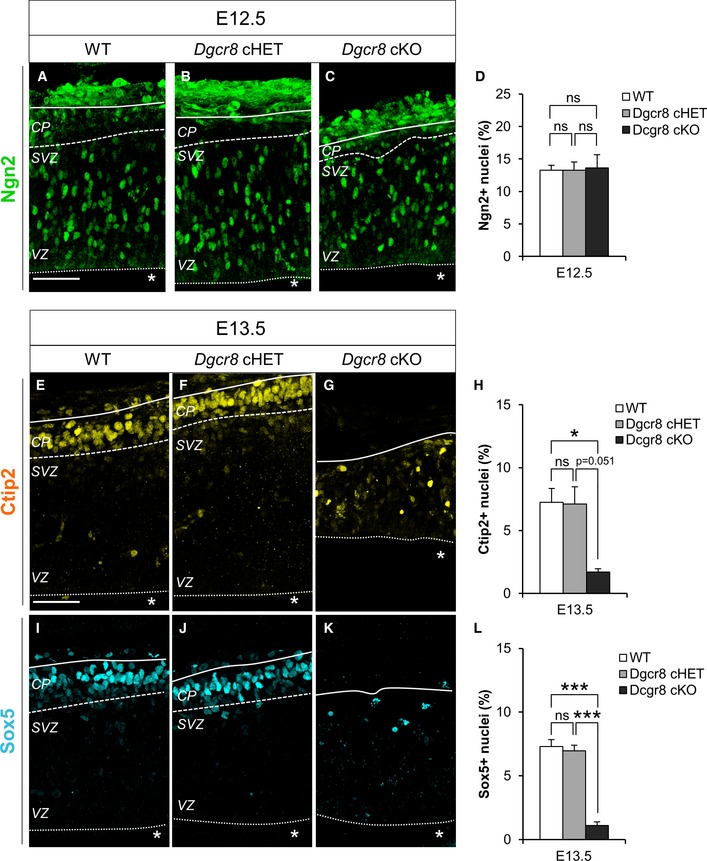
A–C
Immunofluorescence microscopy of coronal cryosections through the dorsal telencephalon of E12.5 WT, Dgcr8 cHET, and Dgcr8 cKO littermate mouse embryos, showing Ngn2 (green) staining.
-
D
Quantification of the proportion of Ngn2+ cells, expressed as a percentage of the total Hoechst‐stained nuclei (not shown).
-
E–G
Immunofluorescence microscopy of coronal cryosections through the dorsal telencephalon of E13.5 WT, Dgcr8 cHET, and Dgcr8 cKO littermate mouse embryos, showing Ctip2 (yellow) staining.
-
H
Quantification of the proportion of Ctip2+ neurons, expressed as a percentage of the total Hoechst‐stained nuclei (not shown).
-
I–K
Immunofluorescence microscopy of coronal cryosections through the dorsal telencephalon of E13.5 WT, Dgcr8 cHET, and Dgcr8 cKO littermate mouse embryos, showing Sox5 (cyan) staining.
-
L
Quantification of the proportion of Sox5+ neurons, expressed as a percentage of the total Hoechst‐stained nuclei (not shown).
Data information: Scale bars: 50 μm. Asterisks indicate the ventricular lumen. Solid and dashed lines indicate cortex boundaries. Cortical plate (CP); subventricular zone (SVZ); ventricular zone (VZ). Pyknotic apoptotic nuclei are excluded from all the quantifications. Bars are mean ± SEM of three embryos per condition (18 counted fields per condition). One‐way ANOVA, *
P < 0.05; ***
P < 0.001; n.s., not significant.