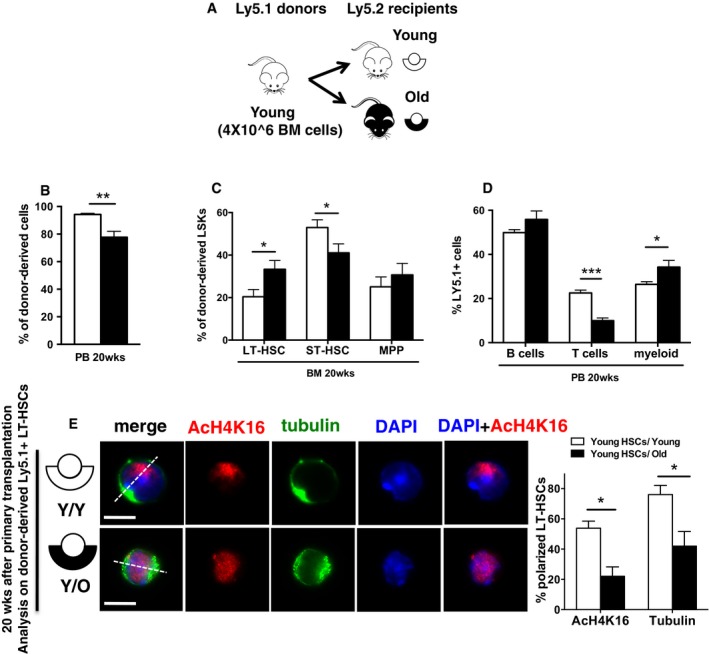
Schematic representation of the experimental setup: (Ly5.1+) BM cells from young were transplanted into either young or old recipient (Ly5.2+) mice. Twenty weeks after transplant, recipient mice were sacrificed and donor‐derived Ly5.1+ cells were analyzed in detail by flow cytometry and cell sorting.
Frequency of young donor contribution (Ly5.1+ cells) to total WBC in PB in young and old recipient (Ly5.2+) mice.
Frequency of young LT‐HSCs, ST‐HSCs and MPP cells in BM among donor‐derived Ly5.1+ LSK cells in young and old recipient (Ly5.2+) mice.
Frequency of young B cells, T cells and myeloid cells among donor‐derived Ly5.1+ cells in PB in young and old recipient (Ly5.2+) mice.
Representative distribution of AcH4k16 (red) and tubulin (green) in donor‐derived LT‐HSCs (Ly5.1+ cells) sorted from the Y→Y and Y→O experimental groups 20 weeks after transplant. Scale bar, 6 μm. Frequency of donor‐derived young LT‐HSCs polarized for AcH4K16 and tubulin sorted from young and old recipient (Ly5.2+) mice. n = 3; ˜40 cells scored per sample in each experimental repetition.
Data information: Data are based on three experimental repeats with five recipient mice per group (e.g.,
n = 15 per group). A paired Student's
t‐test was used to determine the significance of the difference between means of the two groups. Shown are mean values + 1 s.e.m. *
P < 0.05, **
P < 0.01, ***
P < 0.001.