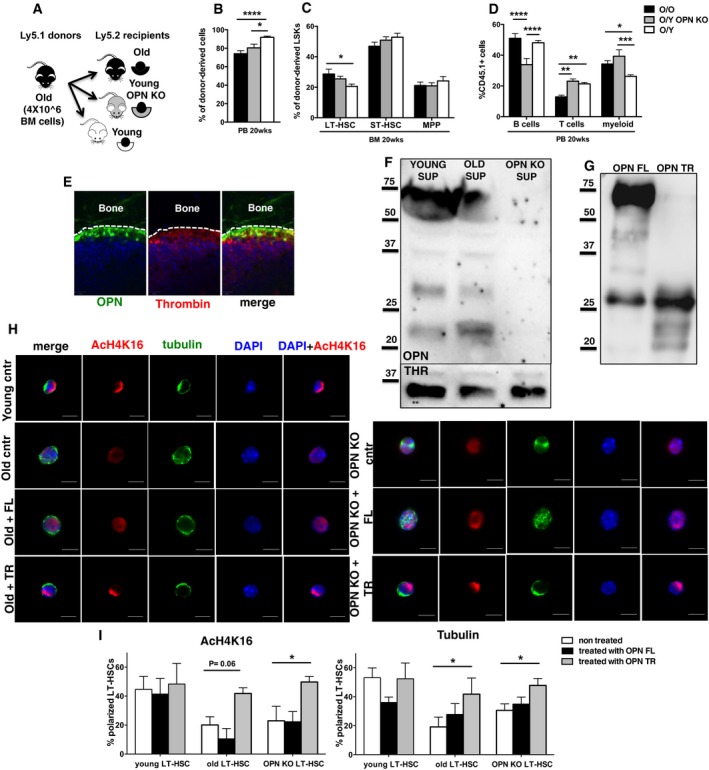
Schematic representation of the experimental setup.
Frequency of old donor contribution (Ly5.1+ cells) to total WBC in PB in young, young OPN KO and old recipient (Ly5.2+) mice.
Frequency of old LT‐HSC, ST‐HSC and MPP cells in BM among donor‐derived LSK cells in young, young OPN KO and old recipients (Ly5.2+) mice.
Frequency of old B cells (B220+), T cells (CD3+) and myeloid cells among donor‐derived Ly5.1+ cells in PB in young, young OPN KO and old recipient (Ly5.2+) mice.
Whole mount immunofluorescence staining on young mouse femors. Representative co‐distribution of OPN (green) and thrombin (red) in the endosteal region of young mouse femurs.
Representative Western blot analysis for OPN and thrombin of the BM supernatants from young, old and OPN KO mice. n = 3.
Western blot analysis showing the OPN full‐length form (OPN FL) and the thrombin‐cleaved OPN truncated form fragments size (OPN TR).
Representative distribution of AcH4k16 (red) and tubulin (green) in young, old, old treated with OPN FL, old treated with OPN TR, OPN KO, OPN KO treated with OPN FL, and OPN KO treated with OPN TR LT‐HSCs. Scale bar, 5 μm.
Percentage of LT‐HSCs polarized for AcH4K16 and tubulin for all the experimental groups. n = 4; ˜40 cells scored per sample in each experimental repetition.
Data information: Data in (B–D) are based on six experimental repeats with five recipient mice per group (e.g.,
= 25–30 per group). Two‐way ANOVA statistic test was used to compare means among the three groups. Shown are mean values + 1 s.e.m. *
< 0.0001.