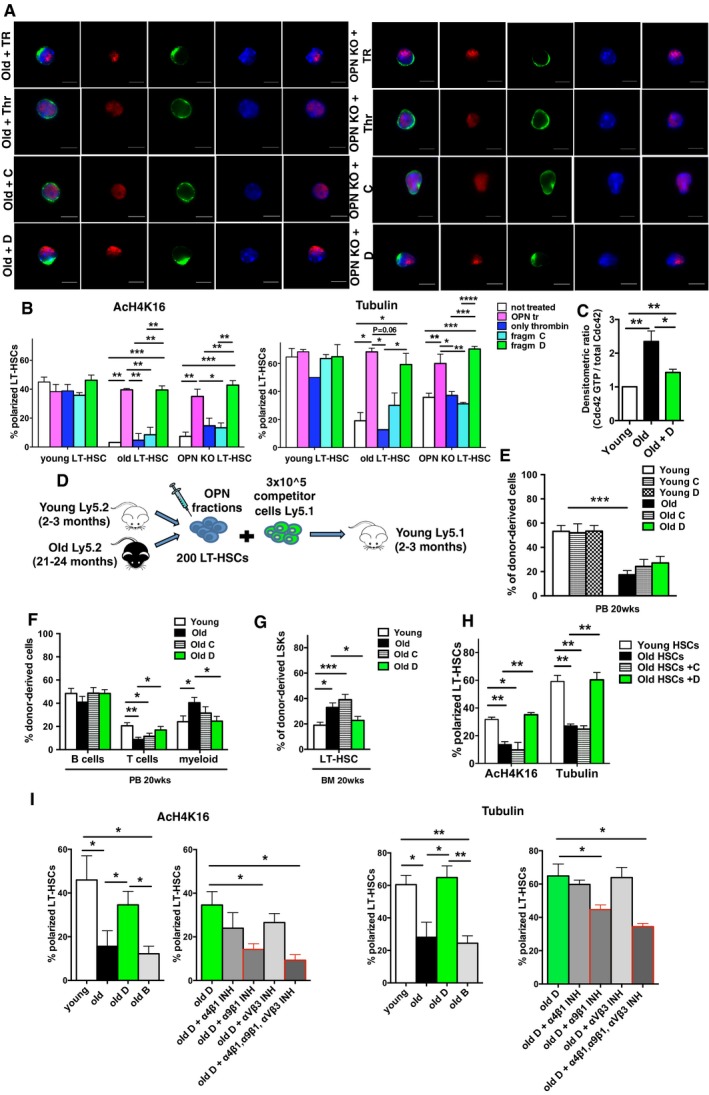
Representative distribution of AcH4k16 (red) and tubulin (green) in old with OPN TR, old treated with thrombin, old treated with fraction C and old treated with fraction D LT‐HSCs (same treatment condition for OPN KO LT‐HSCs). Scale bar, 5 μm.
Percentage of LT‐HSCs polarized for AcH4K16 and tubulin for all the experimental groups. n = 4; ˜40 cells scored per sample in each experimental repetition.
Cdc42 activity in young, old and old treated with fraction D lineage‐depleted bone marrow cells (Lin− BM) determined by pull‐down/Western blot assay. Graph represents the ratio of the densitometric score of the Cdc42‐GTP form and the total Cdc42 expression, n = 5 pull‐down assays.
Schematic representation of the experimental setup.
Frequency of donor contribution to total WBC in PB in young recipient mice 20 weeks after transplantation.
Frequency of old, old with fraction C and old with fraction D, B cells, T cells and myeloid cells among donor‐derived Ly5.2+ cells in PB in young recipient mice.
Frequency of old, old with fraction C and old with fraction D LT‐HSCs in BM among donor‐derived LSK cells in young recipient mice.
Percentage of LT‐HSCs polarized for AcH4K16 and tubulin in donor‐derived LT‐HSCs (Ly5.2+ cells) sorted from the old, old with fraction C and old with fraction D experimental groups 20 weeks after transplant. ˜40 cells scored per sample in each experimental repetition, n = 3.
Percentage of LT‐HSCs polarized for AcH4K16 and tubulin in the experimental groups listed. n = 3; ˜30 cells scored per sample in each experimental repetition.
Data information: Data in (E–I) are based on four experimental repeats with four recipient mice per group (e.g.,
= 12–16 per group). Two‐way ANOVA statistic test was used to compare means among the different groups. Shown are mean values + 1 s.e.m. *
< 0.0001.