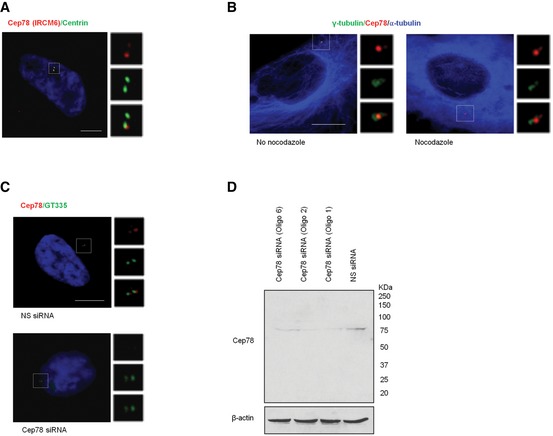
Figure EV1. Characterization of Cep78.

- RPE‐1 cells were stained with DAPI (blue) and antibodies against centrin (green) and Cep78 raised against the C‐terminal region of the protein (IRCM6, red). Scale bar, 1 μm.
- RPE‐1 cells untreated or treated with 10 μM nocodazole for 1 h to induce microtubule depolymerization were stained with antibodies against γ‐tubulin (green), α‐tubulin (blue), and Cep78 (red). Scale bar, 1 μm.
- RPE‐1 cells transfected with NS siRNA or Cep78 siRNA were stained with DAPI (blue) and antibodies against Cep78 (red) and polyglutamylated tubulin (GT335, green). Scale bar, 1 μm.
- RPE‐1 cells were transfected with NS siRNA or Cep78 siRNA (oligo 1, 2 or 6). Lysates were Western blotted with antibody against Cep78. β‐actin was used as a loading control.
Source data are available online for this figure.
